Sysco 2008 Annual Report Download - page 85
Download and view the complete annual report
Please find page 85 of the 2008 Sysco annual report below. You can navigate through the pages in the report by either clicking on the pages listed below, or by using the keyword search tool below to find specific information within the annual report.-
 1
1 -
2
-
3
-
4
-
5
-
6
-
7
-
8
-
9
-
10
-
11
-
12
-
13
-
14
-
15
-
16
-
17
-
18
-
19
-
20
-
21
-
22
-
23
-
24
-
25
-
26
-
27
-
28
-
29
-
30
-
31
-
32
-
33
-
34
-
35
-
36
-
37
-
38
-
39
-
40
-
41
-
42
-
43
-
44
-
45
-
46
-
47
-
48
-
49
-
50
-
51
-
52
-
53
-
54
-
55
-
56
-
57
-
58
-
59
-
60
-
61
-
62
-
63
-
64
-
65
-
66
-
67
-
68
-
69
-
70
-
71
-
72
-
73
-
74
-
 75
75 -
 76
76 -
 77
77 -
 78
78 -
 79
79 -
 80
80 -
 81
81 -
 82
82 -
 83
83 -
 84
84 -
 85
85 -
 86
86 -
 87
87 -
 88
88 -
 89
89 -
 90
90 -
 91
91 -
 92
92 -
 93
93 -
 94
94 -
 95
95 -
96
 |
 |

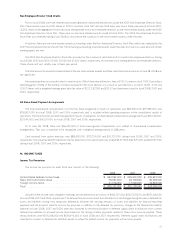
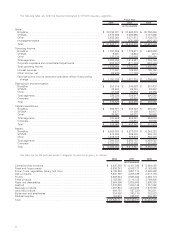
Information concerning geographic areas is as follows:
2008 2007 2006
Fiscal Year
(In thousands)
Sales:
(1)
United States . . . . . . . . . . . . . . . . . . . . . . . . . . . . . . . . . . . . . . . . . . . . $ 33,842,824 $ 31,891,186 $ 29,701,904
Canada . . . . . . . . . . . . . . . . . . . . . . . . . . . . . . . . . . . . . . . . . . . . . . . . 3,380,159 2,923,106 2,783,450
Other. . . . . . . . . . . . . . . . . . . . . . . . . . . . . . . . . . . . . . . . . . . . . . . . . . 299,128 227,783 143,084
Total . . . . . . . . . . . . . . . . . . . . . . . . . . . . . . . . . . . . . . . . . . . . . . . . . . $ 37,522,111 $ 35,042,075 $ 32,628,438
Long-lived assets:
(2)
United States . . . . . . . . . . . . . . . . . . . . . . . . . . . . . . . . . . . . . . . . . . . . $ 2,655,714 $ 2,531,980 $ 2,328,319
Canada . . . . . . . . . . . . . . . . . . . . . . . . . . . . . . . . . . . . . . . . . . . . . . . . 233,879 189,154 136,512
Other. . . . . . . . . . . . . . . . . . . . . . . . . . . . . . . . . . . . . . . . . . . . . . . . . . 197 99 69
Total . . . . . . . . . . . . . . . . . . . . . . . . . . . . . . . . . . . . . . . . . . . . . . . . . . $ 2,889,790 $ 2,721,233 $ 2,464,900
(1)
Represents sales from external customers from businesses operating in these countries.
(2)
Long-lived assets represents net property, plant and equipment reported in the country in which they are held.
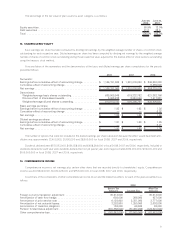
20. SUPPLEMENTAL GUARANTOR INFORMATION
SYSCO International, Co. is an unlimited liability company organized under the laws of the Province of Nova Scotia, Canada and is a
wholly-owned subsidiary of SYSCO. In May 2002, SYSCO International, Co. issued, in a private offering, $200,000,000 of 6.10% notes due
in 2012 (see Note 10, Debt). In December 2002, these notes were exchanged for substantially identical notes in an exchange offer registered
under the Securities Act of 1933. These notes are fully and unconditionally guaranteed by SYSCO. SYSCO International, Co. is a holding
company with no significant sources of income or assets, other than its equity interests in its subsidiaries and interest income from loans
made to its subsidiaries. The proceeds from the issuance of the 6.10% notes were used to repay commercial paper issued to fund the fiscal
2002 acquisition of a Canadian broadline foodservice operation.
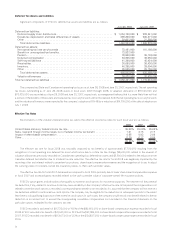
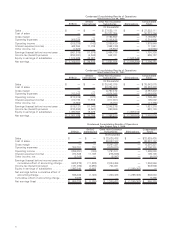
The following condensed consolidating financial statements present separately the financial position, results of operations and cash
flows of the parent guarantor (SYSCO), the subsidiary issuer (SYSCO International) and all other non-guarantor subsidiaries of SYSCO
(Other Non-Guarantor Subsidiaries) on a combined basis and eliminating entries.
SYSCO
SYSCO
International
Other Non-Guarantor
Subsidiaries Eliminations
Consolidated
Totals
Condensed Consolidating Balance Sheet
June 28, 2008
(In thousands)
Current assets . . . . . . . . . . . . . . . . . . $ 526,109 $ — $ 4,648,924 $ — $ 5,175,033
Investment in subsidiaries . . . . . . . . . 14,202,506 398,065 118,041 (14,718,612) —
Plant and equipment, net . . . . . . . . . . 202,778 — 2,687,012 — 2,889,790
Other assets . . . . . . . . . . . . . . . . . . . 593,699 1,262 1,422,509 — 2,017,470
Total assets . . . . . . . . . . . . . . . . . . . . $ 15,525,092 $ 399,327 $ 8,876,486 $ (14,718,612) $ 10,082,293
Current liabilities . . . . . . . . . . . . . . . . $ 412,042 $ 986 $ 3,086,315 $ — $ 3,499,343
Intercompany payables (receivables) . . 9,670,465 100,027 (9,770,492) — —
Long-term debt . . . . . . . . . . . . . . . . . 1,729,401 199,752 46,282 — 1,975,435
Other liabilities. . . . . . . . . . . . . . . . . . 468,213 — 730,316 — 1,198,529
Shareholders’ equity . . . . . . . . . . . . . 3,244,971 98,562 14,784,065 (14,718,612) 3,408,986
Total liabilities and shareholders’
equity . . . . . . . . . . . . . . . . . . . . . . $ 15,525,092 $ 399,327 $ 8,876,486 $ (14,718,612) $ 10,082,293
SYSCO
SYSCO
International
Other Non-Guarantor
Subsidiaries Eliminations
Consolidated
Totals
Condensed Consolidating Balance Sheet
June 30, 2007
(In thousands)
Current assets . . . . . . . . . . . . . . . . . . $ 244,441 $ — $ 4,431,105 $ — $ 4,675,546
Investment in subsidiaries . . . . . . . . . 12,675,360 349,367 126,364 (13,151,091) —
Plant and equipment, net . . . . . . . . . . 170,288 — 2,550,945 — 2,721,233
Other assets . . . . . . . . . . . . . . . . . . . 654,287 — 1,467,865 — 2,122,152
Total assets . . . . . . . . . . . . . . . . . . . . $ 13,744,376 $ 349,367 $ 8,576,279 $ (13,151,091) $ 9,518,931
Current liabilities . . . . . . . . . . . . . . . . $ 371,149 $ 1,034 $ 3,042,906 $ — $ 3,415,089
Intercompany payables (receivables) . . 8,251,239 44,757 (8,295,996) — —
Long-term debt . . . . . . . . . . . . . . . . . 1,471,428 243,786 43,013 — 1,758,227
Other liabilities. . . . . . . . . . . . . . . . . . 505,660 — 561,555 — 1,067,215
Shareholders’ equity. . . . . . . . . . . . . . 3,144,900 59,790 13,224,801 (13,151,091) 3,278,400
Total liabilities and shareholders’
equity . . . . . . . . . . . . . . . . . . . . . . $ 13,744,376 $ 349,367 $ 8,576,279 $ (13,151,091) $ 9,518,931
61