Sysco 2008 Annual Report Download - page 60
Download and view the complete annual report
Please find page 60 of the 2008 Sysco annual report below. You can navigate through the pages in the report by either clicking on the pages listed below, or by using the keyword search tool below to find specific information within the annual report.-
 1
1 -
2
-
3
-
4
-
5
-
6
-
7
-
8
-
9
-
10
-
11
-
12
-
13
-
14
-
15
-
16
-
17
-
18
-
19
-
20
-
21
-
22
-
23
-
24
-
25
-
26
-
27
-
28
-
29
-
30
-
31
-
32
-
33
-
34
-
35
-
36
-
37
-
38
-
39
-
40
-
41
-
42
-
43
-
44
-
45
-
46
-
47
-
48
-
49
-
 50
50 -
 51
51 -
 52
52 -
 53
53 -
 54
54 -
 55
55 -
 56
56 -
 57
57 -
 58
58 -
 59
59 -
 60
60 -
 61
61 -
 62
62 -
 63
63 -
 64
64 -
 65
65 -
 66
66 -
 67
67 -
 68
68 -
 69
69 -
 70
70 -
71
-
72
-
73
-
74
-
75
-
76
-
77
-
78
-
79
-
80
-
81
-
82
-
83
-
84
-
85
-
86
-
87
-
88
-
89
-
90
-
91
-
92
-
93
-
94
-
95
-
96
 |
 |

SYSCO
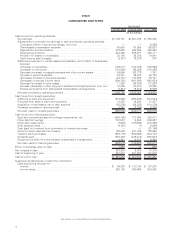
CONSOLIDATED RESULTS OF OPERATIONS
June 28, 2008 June 30, 2007 July 1, 2006
Year Ended
(In thousands except for share data)
Sales . . . . . . . . . . . . . . . . . . . . . . . . . . . . . . . . . . . . . . . . . . . . . . . . . . . . $ 37,522,111 $ 35,042,075 $ 32,628,438
Cost of sales . . . . . . . . . . . . . . . . . . . . . . . . . . . . . . . . . . . . . . . . . . . . . . . 30,327,254 28,284,603 26,337,107
Gross margin . . . . . . . . . . . . . . . . . . . . . . . . . . . . . . . . . . . . . . . . . . . . . . 7,194,857 6,757,472 6,291,331
Operating expenses . . . . . . . . . . . . . . . . . . . . . . . . . . . . . . . . . . . . . . . . . . 5,314,908 5,048,990 4,796,301
Operating income . . . . . . . . . . . . . . . . . . . . . . . . . . . . . . . . . . . . . . . . . . . 1,879,949 1,708,482 1,495,030
Interest expense . . . . . . . . . . . . . . . . . . . . . . . . . . . . . . . . . . . . . . . . . . . . 111,541 105,002 109,100
Other income, net . . . . . . . . . . . . . . . . . . . . . . . . . . . . . . . . . . . . . . . . . . . (22,930) (17,735) (9,016)
Earnings before income taxes and cumulative effect of accounting change . . 1,791,338 1,621,215 1,394,946
Income taxes . . . . . . . . . . . . . . . . . . . . . . . . . . . . . . . . . . . . . . . . . . . . . . 685,187 620,139 548,906
Earnings before cumulative effect of accounting change. . . . . . . . . . . . . . . . 1,106,151 1,001,076 846,040
Cumulative effect of accounting change . . . . . . . . . . . . . . . . . . . . . . . . . . . — — 9,285
Net earnings . . . . . . . . . . . . . . . . . . . . . . . . . . . . . . . . . . . . . . . . . . . . . . . $ 1,106,151 $ 1,001,076 $ 855,325
Earnings before cumulative effect of accounting change:
Basic earnings per share . . . . . . . . . . . . . . . . . . . . . . . . . . . . . . . . . . . . . $ 1.83 $ 1.62 $ 1.36
Diluted earnings per share . . . . . . . . . . . . . . . . . . . . . . . . . . . . . . . . . . . 1.81 1.60 1.35
Net earnings:
Basic earnings per share . . . . . . . . . . . . . . . . . . . . . . . . . . . . . . . . . . . . . $ 1.83 1.62 1.38
Diluted earnings per share . . . . . . . . . . . . . . . . . . . . . . . . . . . . . . . . . . . 1.81 1.60 1.36
See Notes to Consolidated Financial Statements
36