Sysco 2008 Annual Report Download - page 86
Download and view the complete annual report
Please find page 86 of the 2008 Sysco annual report below. You can navigate through the pages in the report by either clicking on the pages listed below, or by using the keyword search tool below to find specific information within the annual report.-
 1
1 -
2
-
3
-
4
-
5
-
6
-
7
-
8
-
9
-
10
-
11
-
12
-
13
-
14
-
15
-
16
-
17
-
18
-
19
-
20
-
21
-
22
-
23
-
24
-
25
-
26
-
27
-
28
-
29
-
30
-
31
-
32
-
33
-
34
-
35
-
36
-
37
-
38
-
39
-
40
-
41
-
42
-
43
-
44
-
45
-
46
-
47
-
48
-
49
-
50
-
51
-
52
-
53
-
54
-
55
-
56
-
57
-
58
-
59
-
60
-
61
-
62
-
63
-
64
-
65
-
66
-
67
-
68
-
69
-
70
-
71
-
72
-
73
-
74
-
75
-
 76
76 -
 77
77 -
 78
78 -
 79
79 -
 80
80 -
 81
81 -
 82
82 -
 83
83 -
 84
84 -
 85
85 -
 86
86 -
 87
87 -
 88
88 -
 89
89 -
 90
90 -
 91
91 -
 92
92 -
 93
93 -
 94
94 -
 95
95 -
 96
96
 |
 |

SYSCO
SYSCO
International
Other Non-Guarantor
Subsidiaries Eliminations
Consolidated
Totals
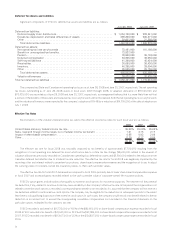
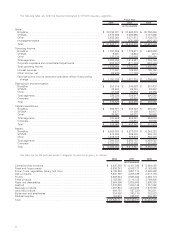
Condensed Consolidating Results of Operations
Year Ended June 28, 2008
(In thousands)
Sales . . . . . . . . . . . . . . . . . . . . . . . . . . . $ — $ — $ 37,522,111 $ — $ 37,522,111
Cost of sales . . . . . . . . . . . . . . . . . . . . . — — 30,327,254 — 30,327,254
Gross margin . . . . . . . . . . . . . . . . . . . . . — — 7,194,857 — 7,194,857
Operating expenses . . . . . . . . . . . . . . . . 206,338 142 5,108,428 — 5,314,908
Operating income . . . . . . . . . . . . . . . . . . (206,338) (142) 2,086,429 — 1,879,949
Interest expense (income) . . . . . . . . . . . . 462,554 11,736 (362,749) — 111,541
Other income, net . . . . . . . . . . . . . . . . . . (7,373) — (15,557) — (22,930)
Earnings (losses) before income taxes . . . (661,519) (11,878) 2,464,735 — 1,791,338
Income tax (benefit) provision . . . . . . . . . (253,031) (4,543) 942,761 — 685,187
Equity in earnings of subsidiaries . . . . . . . 1,514,639 33,907 — (1,548,546) —
Net earnings . . . . . . . . . . . . . . . . . . . . . . $ 1,106,151 $ 26,572 $ 1,521,974 $ (1,548,546) $ 1,106,151
SYSCO
SYSCO
International
Other Non-Guarantor
Subsidiaries Eliminations
Consolidated
Totals
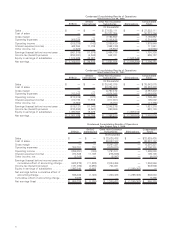
Condensed Consolidating Results of Operations
Year Ended June 30, 2007
(In thousands)
Sales . . . . . . . . . . . . . . . . . . . . . . . . . . . $ — $ — $ 35,042,075 $ — $ 35,042,075
Cost of sales . . . . . . . . . . . . . . . . . . . . . — — 28,284,603 — 28,284,603
Gross margin . . . . . . . . . . . . . . . . . . . . . — — 6,757,472 — 6,757,472
Operating expenses . . . . . . . . . . . . . . . . 213,915 127 4,834,948 — 5,048,990
Operating income . . . . . . . . . . . . . . . . . . (213,915) (127) 1,922,524 — 1,708,482
Interest expense (income) . . . . . . . . . . . . 410,190 11,813 (317,001) — 105,002
Other income, net . . . . . . . . . . . . . . . . . . (8,984) — (8,751) — (17,735)
Earnings (losses) before income taxes . . . (615,121) (11,940) 2,248,276 — 1,621,215
Income tax (benefit) provision . . . . . . . . . (235,260) (4,567) 859,966 — 620,139
Equity in earnings of subsidiaries . . . . . . . 1,380,937 18,075 — (1,399,012) —
Net earnings . . . . . . . . . . . . . . . . . . . . . . $ 1,001,076 $ 10,702 $ 1,388,310 $ (1,399,012) $ 1,001,076
SYSCO
SYSCO
International
Other Non-Guarantor
Subsidiaries Eliminations
Consolidated
Totals
Condensed Consolidating Results of Operations
Year Ended July 1, 2006
(In thousands)
Sales . . . . . . . . . . . . . . . . . . . . . . . . . . . . . $ — $ — $ 32,628,438 $ — $32,628,438
Cost of sales. . . . . . . . . . . . . . . . . . . . . . . . — — 26,337,107 — 26,337,107
Gross margin . . . . . . . . . . . . . . . . . . . . . . . — — 6,291,331 — 6,291,331
Operating expenses . . . . . . . . . . . . . . . . . . 256,351 130 4,539,820 — 4,796,301
Operating income . . . . . . . . . . . . . . . . . . . . (256,351) (130) 1,751,511 — 1,495,030
Interest expense (income) . . . . . . . . . . . . . . 374,838 11,108 (276,846) — 109,100
Other income, net . . . . . . . . . . . . . . . . . . . . (2,919) — (6,097) — (9,016)
Earnings (losses) before income taxes and
cumulative effect of accounting change . . . (628,270) (11,238) 2,034,454 — 1,394,946
Income tax (benefit) provision . . . . . . . . . . . (181,070) (4,055) 734,031 — 548,906
Equity in earnings of subsidiaries . . . . . . . . . 1,293,240 6,063 — (1,299,303) —
Net earnings before cumulative effect of
accounting change . . . . . . . . . . . . . . . . . . 846,040 (1,120) 1,300,423 (1,299,303) 846,040
Cumulative effect of accounting change . . . . 9,285 — — — 9,285
Net earnings (loss) . . . . . . . . . . . . . . . . . . . $ 855,325 $ (1,120) $ 1,300,423 $ (1,299,303) $ 855,325
62