Sysco 2008 Annual Report Download - page 74
Download and view the complete annual report
Please find page 74 of the 2008 Sysco annual report below. You can navigate through the pages in the report by either clicking on the pages listed below, or by using the keyword search tool below to find specific information within the annual report.-
 1
1 -
2
-
3
-
4
-
5
-
6
-
7
-
8
-
9
-
10
-
11
-
12
-
13
-
14
-
15
-
16
-
17
-
18
-
19
-
20
-
21
-
22
-
23
-
24
-
25
-
26
-
27
-
28
-
29
-
30
-
31
-
32
-
33
-
34
-
35
-
36
-
37
-
38
-
39
-
40
-
41
-
42
-
43
-
44
-
45
-
46
-
47
-
48
-
49
-
50
-
51
-
52
-
53
-
54
-
55
-
56
-
57
-
58
-
59
-
60
-
61
-
62
-
63
-
 64
64 -
 65
65 -
 66
66 -
 67
67 -
 68
68 -
 69
69 -
 70
70 -
 71
71 -
 72
72 -
 73
73 -
 74
74 -
 75
75 -
 76
76 -
 77
77 -
 78
78 -
 79
79 -
 80
80 -
 81
81 -
 82
82 -
 83
83 -
 84
84 -
85
-
86
-
87
-
88
-
89
-
90
-
91
-
92
-
93
-
94
-
95
-
96
 |
 |

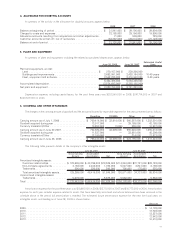
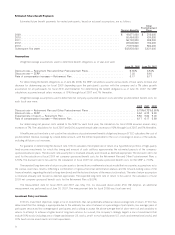
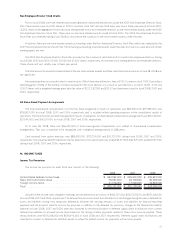
Estimated Future Benefit Payments
Estimated future benefit payments for vested participants, based on actuarial assumptions, are as follows:
Pension Benefits
Other
Postretirement
Plans
2009 . . . . . . . . . . . . . . . . . . . . . . . . . . . . . . . . . . . . . . . . . . . . . . . . . . . . . . . . . . . . . . . . $ 44,671,000 $ 319,000
2010 . . . . . . . . . . . . . . . . . . . . . . . . . . . . . . . . . . . . . . . . . . . . . . . . . . . . . . . . . . . . . . . . 50,484,000 434,000
2011 . . . . . . . . . . . . . . . . . . . . . . . . . . . . . . . . . . . . . . . . . . . . . . . . . . . . . . . . . . . . . . . . 56,792,000 608,000
2012 . . . . . . . . . . . . . . . . . . . . . . . . . . . . . . . . . . . . . . . . . . . . . . . . . . . . . . . . . . . . . . . . 63,500,000 732,000
2013 . . . . . . . . . . . . . . . . . . . . . . . . . . . . . . . . . . . . . . . . . . . . . . . . . . . . . . . . . . . . . . . . 71,919,000 863,000
Subsequent five years . . . . . . . . . . . . . . . . . . . . . . . . . . . . . . . . . . . . . . . . . . . . . . . . . . . 503,938,000 5,431,000
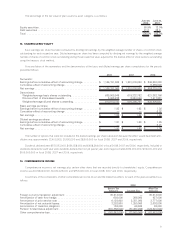
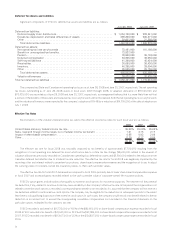
Assumptions
Weighted-average assumptions used to determine benefit obligations as of year-end were:
June 28, 2008 June 30, 2007
Discount rate — Retirement Plan and Other Postretirement Plans. . . . . . . . . . . . . . . . . . . . . . . 6.94% 6.54%
Discount rate — SERP . . . . . . . . . . . . . . . . . . . . . . . . . . . . . . . . . . . . . . . . . . . . . . . . . . . . . . 7.03 6.40
Rate of compensation increase — Retirement Plan . . . . . . . . . . . . . . . . . . . . . . . . . . . . . . . . . 6.17 6.17
For determining the benefit obligations as of June 28, 2008, the SERP calculations assume various levels of base salary increase and
decrease for determining pay for fiscal 2009 depending upon the participant’s position with the company and a 7% salary growth
assumption for all participants for fiscal 2010 and thereafter. For determining the benefit obligations as of June 30, 2007, the SERP
calculations assumed annual salary increases of 10% through fiscal 2007 and 7% thereafter.
Weighted-average assumptions used to determine net company-sponsored pension costs and other postretirement benefit costs for
each fiscal year were:
2008 2007 2006
Discount rate — Retirement Plan and Other Postretirement Plans . . . . . . . . . . . . . . . . . . . . . . . . . . . . . . 6.78%6.73%5.60%
Discount rate — SERP . . . . . . . . . . . . . . . . . . . . . . . . . . . . . . . . . . . . . . . . . . . . . . . . . . . . . . . . . . . . . 6.64 6.73 5.60
Expected rate of return — Retirement Plan . . . . . . . . . . . . . . . . . . . . . . . . . . . . . . . . . . . . . . . . . . . . . . . 8.50 9.00 9.00
Rate of compensation increase — Retirement Plan . . . . . . . . . . . . . . . . . . . . . . . . . . . . . . . . . . . . . . . . . 6.17 6.17 5.89
For determining net pension costs related to the SERP for each fiscal year, the calculation for fiscal 2008 assumes annual salary
increases of 7%.The calculations for fiscal 2007 and 2006 assumed annual salary increases of 10% through fiscal 2007 and 7% thereafter.
A healthcare cost trend rate is not used in the calculations of postretirement benefits obligations because SYSCO subsidizes the cost of
postretirement medical coverage by a fixed dollar amount, with the retiree responsible for the cost of coverage in excess of the subsidy,
including all future cost increases.
For guidance in determining the discount rate, SYSCO calculates the implied rate of return on a hypothetical portfolio of high-quality
fixed-income investments for which the timing and amount of cash outflows approximates the estimated payouts of the company-
sponsored pension plans. The discount rate assumption is reviewed annually and revised as deemed appropriate. The discount rate to be
used for the calculation of fiscal 2009 net company-sponsored benefit costs for the Retirement Plan and Other Postretirement Plans is
6.94%. The discount rate to be used for the calculation of fiscal 2009 net company-sponsored benefit costs for the SERP is 7.03%.
The expected long-term rate of return on plan assets is derived from a mathematical asset model that incorporates assumptions as to
the various asset class returns, reflecting a combination of rigorous historical performance analysis and the forward-looking views of the
financial markets regarding the yield on long-term bonds and the historical returns of the major stock markets.The rate of return assumption
is reviewed annually and revised as deemed appropriate. The expected long-term rate of return to be used in the calculation of fiscal
2009 net company-sponsored benefit costs for the Retirement Plan is 8.00%.
The measurement date for fiscal 2006 and 2007 was May 31st. As discussed above under SFAS 158 Adoption, an additional
measurement was performed as of June 30, 2007. The measurement date for fiscal 2008 was fiscal year-end.
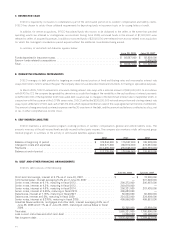
Investment Policy and Assets
SYSCO’s investment objectives target a mix of investments that can potentially achieve an above-average rate of return. SYSCO has
determined that this strategy is appropriate due to the relatively low ratio of retirees as a percentage of participants, low average years of
participant service and low average age of participants and is willing to accept the above-average level of short-term risk and variability in
returns to attempt to achieve a higher level of long-term returns. As a result, the company’s strategy targets a mix of investments that
include 70% stocks (including a mix of large capitalization U.S. stocks, small- to mid-capitalization U.S. stocks and international stocks) and
30% fixed income investments and cash equivalents.
50