Sysco 2008 Annual Report Download - page 88
Download and view the complete annual report
Please find page 88 of the 2008 Sysco annual report below. You can navigate through the pages in the report by either clicking on the pages listed below, or by using the keyword search tool below to find specific information within the annual report.-
 1
1 -
2
-
3
-
4
-
5
-
6
-
7
-
8
-
9
-
10
-
11
-
12
-
13
-
14
-
15
-
16
-
17
-
18
-
19
-
20
-
21
-
22
-
23
-
24
-
25
-
26
-
27
-
28
-
29
-
30
-
31
-
32
-
33
-
34
-
35
-
36
-
37
-
38
-
39
-
40
-
41
-
42
-
43
-
44
-
45
-
46
-
47
-
48
-
49
-
50
-
51
-
52
-
53
-
54
-
55
-
56
-
57
-
58
-
59
-
60
-
61
-
62
-
63
-
64
-
65
-
66
-
67
-
68
-
69
-
70
-
71
-
72
-
73
-
74
-
75
-
76
-
77
-
 78
78 -
 79
79 -
 80
80 -
 81
81 -
 82
82 -
 83
83 -
 84
84 -
 85
85 -
 86
86 -
 87
87 -
 88
88 -
 89
89 -
 90
90 -
 91
91 -
 92
92 -
 93
93 -
 94
94 -
 95
95 -
 96
96
 |
 |

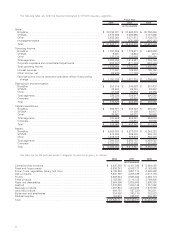
21. QUARTERLY RESULTS (UNAUDITED)
Financial information for each quarter in the years ended June 28, 2008 and June 30, 2007 is set forth below:
September 29 December 29 March 29 June 28 Fiscal Year
Fiscal 2008 Quarter Ended
(In thousands except for share data)
Sales. . . . . . . . . . . . . . . . . . . . . . . . . . . . . . . $ 9,405,844 $ 9,239,505 $ 9,146,557 $ 9,730,205 $ 37,522,111
Cost of sales . . . . . . . . . . . . . . . . . . . . . . . . . 7,614,702 7,471,725 7,412,036 7,828,791 30,327,254
Gross margin . . . . . . . . . . . . . . . . . . . . . . . . . 1,791,142 1,767,780 1,734,521 1,901,414 7,194,857
Operating expenses . . . . . . . . . . . . . . . . . . . . 1,336,509 1,318,768 1,316,877 1,342,754 5,314,908
Operating income. . . . . . . . . . . . . . . . . . . . . . 454,633 449,012 417,644 558,660 1,879,949
Interest expense . . . . . . . . . . . . . . . . . . . . . . 26,371 28,915 28,744 27,511 111,541
Other income, net . . . . . . . . . . . . . . . . . . . . . (3,032) (8,343) (7,285) (4,270) (22,930)
Earnings before income taxes . . . . . . . . . . . . . 431,294 428,440 396,185 535,419 1,791,338
Income taxes . . . . . . . . . . . . . . . . . . . . . . . . . 164,305 164,292 155,284 201,306 685,187
Net earnings . . . . . . . . . . . . . . . . . . . . . . . . . $ 266,989 $ 264,148 $ 240,901 $ 334,113 $ 1,106,151
Per share:
Basic net earnings . . . . . . . . . . . . . . . . . . . $ 0.44 $ 0.43 $ 0.40 $ 0.56 $ 1.83
Diluted net earnings . . . . . . . . . . . . . . . . . . 0.43 0.43 0.40 0.55 1.81
Dividends declared . . . . . . . . . . . . . . . . . . . 0.19 0.22 0.22 0.22 0.85
Market price — high/low . . . . . . . . . . . . . . . 36-30 36-31 32-26 32-27 36-26
September 30 December 30 March 31 June 30 Fiscal Year
Fiscal 2007 Quarter Ended
(In thousands except for share data)
Sales. . . . . . . . . . . . . . . . . . . . . . . . . . . . . . . $ 8,672,072 $ 8,568,748 $ 8,572,961 $ 9,228,294 $ 35,042,075
Cost of sales . . . . . . . . . . . . . . . . . . . . . . . . . 7,002,856 6,915,259 6,938,867 7,427,621 28,284,603
Gross margin . . . . . . . . . . . . . . . . . . . . . . . . . 1,669,216 1,653,489 1,634,094 1,800,673 6,757,472
Operating expenses . . . . . . . . . . . . . . . . . . . . 1,276,882 1,230,967 1,249,951 1,291,190 5,048,990
Operating income. . . . . . . . . . . . . . . . . . . . . . 392,334 422,522 384,143 509,483 1,708,482
Interest expense . . . . . . . . . . . . . . . . . . . . . . 25,766 28,006 25,700 25,530 105,002
Other income, net . . . . . . . . . . . . . . . . . . . . . (9,038) (3,375) (2,536) (2,786) (17,735)
Earnings before income taxes . . . . . . . . . . . . . 375,606 397,891 360,979 486,739 1,621,215
Income taxes . . . . . . . . . . . . . . . . . . . . . . . . . 145,458 151,353 139,980 183,348 620,139
Net earnings . . . . . . . . . . . . . . . . . . . . . . . . . $ 230,148 $ 246,538 $ 220,999 $ 303,391 $ 1,001,076
Per share:
Basic net earnings . . . . . . . . . . . . . . . . . . . $ 0.37 $ 0.40 $ 0.36 $ 0.49 $ 1.62
Diluted net earnings . . . . . . . . . . . . . . . . . . 0.37 0.39 0.35 0.49 1.60
Dividends declared . . . . . . . . . . . . . . . . . . . 0.17 0.19 0.19 0.19 0.74
Market price — high/low . . . . . . . . . . . . . . . 34-27 37-32 37-31 35-32 37-27
Percentage increases— 2008 vs. 2007:
Sales. . . . . . . . . . . . . . . . . . . . . . . . . . . . . . . 8% 8% 7% 5% 7%
Operating income. . . . . . . . . . . . . . . . . . . . . . 16 6 9 10 10
Net earnings . . . . . . . . . . . . . . . . . . . . . . . . . 16 7 9 10 11
Basic net earnings per share . . . . . . . . . . . . . . 19 8 11 14 13
Diluted net earnings per share. . . . . . . . . . . . . 16 10 14 12 13
Financial results are impacted by accounting changes and the adoption of various accounting standards. See Note 2, Changes in Accounting.
64