Yahoo 2005 Annual Report Download - page 101
Download and view the complete annual report
Please find page 101 of the 2005 Yahoo annual report below. You can navigate through the pages in the report by either clicking on the pages listed below, or by using the keyword search tool below to find specific information within the annual report.-
 1
1 -
2
-
3
-
4
-
5
-
6
-
7
-
8
-
9
-
10
-
11
-
12
-
13
-
14
-
15
-
16
-
17
-
18
-
19
-
20
-
21
-
22
-
23
-
24
-
25
-
26
-
27
-
28
-
29
-
30
-
31
-
32
-
33
-
34
-
35
-
36
-
37
-
38
-
39
-
40
-
41
-
42
-
43
-
44
-
45
-
46
-
47
-
48
-
49
-
50
-
51
-
52
-
53
-
54
-
55
-
56
-
57
-
58
-
59
-
60
-
61
-
62
-
63
-
64
-
65
-
66
-
67
-
68
-
69
-
70
-
71
-
72
-
73
-
74
-
75
-
76
-
77
-
78
-
79
-
80
-
81
-
82
-
83
-
84
-
85
-
86
-
87
-
88
-
89
-
90
-
 91
91 -
 92
92 -
 93
93 -
 94
94 -
 95
95 -
 96
96 -
 97
97 -
 98
98 -
 99
99 -
 100
100 -
 101
101 -
 102
102 -
 103
103 -
 104
104 -
 105
105 -
 106
106 -
 107
107 -
 108
108 -
 109
109 -
 110
110 -
 111
111 -
112
-
113
-
114
-
115
-
116
-
117
-
118
 |
 |

95
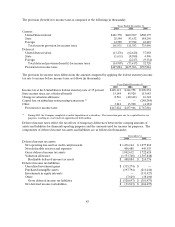
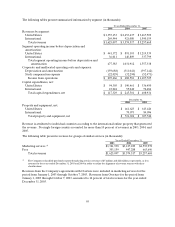
The following tables present summarized information by segment (in thousands):
Years Ended December 31,
2003 2004 2005
Revenues by segment:
United States $ 1,355,153 $ 2,653,437 $ 3,667,509
International 269,944 921,080 1,590,159
Total revenues $ 1,625,097 $ 3,574,517 $ 5,257,668
Segment operating income before depreciation and
amortization:
United States $ 441,372 $ 891,103 $ 1,219,539
International 36,011 140,809 337,799
Total segment operating income before depreciation and
amortization 477,383 1,031,912 1,557,338
Corporate and unallocated operating costs and expenses:
Depreciation and amortization (159,688) (311,041 ) (397,142)
Stock compensation expense (22,029) (32,290 ) (52,471)
Income from operations $ 295,666 $ 688,581 $ 1,107,725
Capital expenditures, net:
United States $ 94,305 $ 190,461 $ 336,450
International 23,024 55,040 72,484
Total capital expenditures, net $ 117,329 $ 245,501 $ 408,934
December 31,
2004 2005
Property and equipment, net:
United States $ 461,623 $ 613,426
International 70,073 84,096
Total property and equipment, net $ 531,696 $ 697,522
Revenue is attributed to individual countries according to the international online property that generated
the revenue. No single foreign country accounted for more than 10 percent of revenues in 2003, 2004, and
2005.
The following table presents revenues for groups of similar services (in thousands):
Years Ended December 31,
2003 2004 2005
Marketing services (1) $1,321,938 $3,127,229 $4,593,972
Fees 303,159 447,288 663,696
Total revenues $1,625,097 $3,574,517 $5,257,668
(1) The Company reclassified previously reported marketing services revenue of $5 million and $22 million, respectively, as fees
revenue for the years ended December 31, 2003 and 2004 in order to refine the alignment of revenue sources with these
classifications.
Revenues from the Company’s agreements with Overture were included in marketing services for the
period from January 1, 2003 through October 7, 2003. Revenues from Overture for the period from
January 1, 2003 through October 7, 2003, amounted to 12 percent of total revenues for the year ended
December 31, 2003.