Yahoo 2005 Annual Report Download - page 43
Download and view the complete annual report
Please find page 43 of the 2005 Yahoo annual report below. You can navigate through the pages in the report by either clicking on the pages listed below, or by using the keyword search tool below to find specific information within the annual report.-
 1
1 -
2
-
3
-
4
-
5
-
6
-
7
-
8
-
9
-
10
-
11
-
12
-
13
-
14
-
15
-
16
-
17
-
18
-
19
-
20
-
21
-
22
-
23
-
24
-
25
-
26
-
27
-
28
-
29
-
30
-
31
-
32
-
 33
33 -
 34
34 -
 35
35 -
 36
36 -
 37
37 -
 38
38 -
 39
39 -
 40
40 -
 41
41 -
 42
42 -
 43
43 -
 44
44 -
 45
45 -
 46
46 -
 47
47 -
 48
48 -
 49
49 -
 50
50 -
 51
51 -
 52
52 -
 53
53 -
54
-
55
-
56
-
57
-
58
-
59
-
60
-
61
-
62
-
63
-
64
-
65
-
66
-
67
-
68
-
69
-
70
-
71
-
72
-
73
-
74
-
75
-
76
-
77
-
78
-
79
-
80
-
81
-
82
-
83
-
84
-
85
-
86
-
87
-
88
-
89
-
90
-
91
-
92
-
93
-
94
-
95
-
96
-
97
-
98
-
99
-
100
-
101
-
102
-
103
-
104
-
105
-
106
-
107
-
108
-
109
-
110
-
111
-
112
-
113
-
114
-
115
-
116
-
117
-
118
 |
 |
37
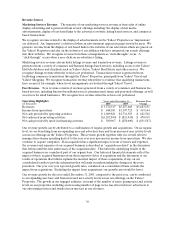
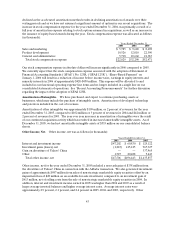
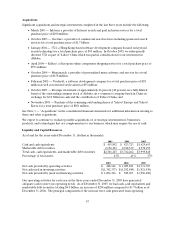
In addition, during 2005 we invested over $2.0 billion in significant acquisitions including business
combinations, asset acquisitions and a strategic investment, predominantly internationally, which we
believe will position us to benefit from the growing global online advertising market.
Cash generated from our operations is a measure of the cash productivity of our business model and is an
area of focus for us. The growth of cash flow from operations is primarily driven by our increasing net
income adjusted for non-cash items such as depreciation and amortization, tax benefits from stock options,
as well as non operating gains or losses. In 2005, non operating gains included gains from sales of
marketable equity securities and the divestiture of Yahoo! China in connection with the Alibaba
transaction. Cash used in investing activities in 2005 included our cash consideration for acquisitions,
including the strategic investment in Alibaba, offset by proceeds from sales of marketable equity securities.
Cash used in financing activities in 2005 reflected our net cash used for direct stock repurchases and
structured stock repurchase transactions offset by cash proceeds from the issuance of common stock as a
result of the exercise of employee stock options.
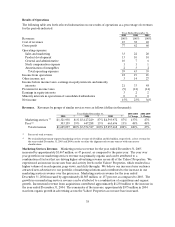
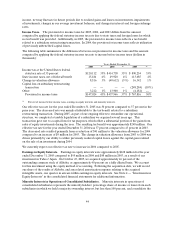
During the year ended December 31, 2005, we recorded gains of approximately $987 million related to
sales of non-strategic marketable equity securities, and a non-cash gain of $338 million related to the
divestiture of Yahoo! China in connection with the Alibaba transaction. These gains of approximately
$1.3 billion are included in other income, net in the consolidated statements of operations. Other income,
net may fluctuate in future periods due to realized gains and losses on investments, impairments of
investments, changes in our average investment balances, and changes in interest and foreign exchange
rates.
The provision for income taxes for 2005 was $768 million and yielded an effective tax rate of 30 percent for
2005, compared to an effective tax rate of 37 percent for 2004 and 43 percent for 2003. The lower effective
tax rate for 2005 was primarily a result of a tax benefit of approximately $248 million related to a subsidiary
restructuring transaction completed during 2005. We currently expect our effective tax rate to increase in
2006 compared to 2005.
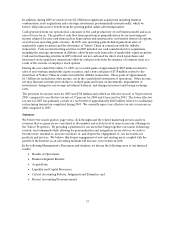
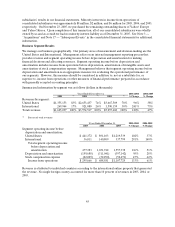
Summary
We believe the search queries, page views, click-throughs and the related marketing services and fees
revenues that we generate are correlated to the number and activity level of users across our offerings on
the Yahoo! Properties. By providing a platform for our users that brings together our search technology,
content, and community while allowing for personalization and integration across devices, we seek to
become more essential to, increase our share of, and deepen the engagement of, our users with our
products and services. We believe this deeper engagement of new and existing users, coupled with the
growth of the Internet as an advertising medium will increase our revenues in 2006.
In the following Management’s Discussion and Analysis, we discuss the following areas of our financial
results:
• Results of Operations;
• Business Segment Results;
• Acquisitions;
• Liquidity and Capital Resources;
• Critical Accounting Policies, Judgments and Estimates; and
• Recent Accounting Pronouncements.