Yahoo 2005 Annual Report Download - page 51
Download and view the complete annual report
Please find page 51 of the 2005 Yahoo annual report below. You can navigate through the pages in the report by either clicking on the pages listed below, or by using the keyword search tool below to find specific information within the annual report.-
 1
1 -
2
-
3
-
4
-
5
-
6
-
7
-
8
-
9
-
10
-
11
-
12
-
13
-
14
-
15
-
16
-
17
-
18
-
19
-
20
-
21
-
22
-
23
-
24
-
25
-
26
-
27
-
28
-
29
-
30
-
31
-
32
-
33
-
34
-
35
-
36
-
37
-
38
-
39
-
40
-
 41
41 -
 42
42 -
 43
43 -
 44
44 -
 45
45 -
 46
46 -
 47
47 -
 48
48 -
 49
49 -
 50
50 -
 51
51 -
 52
52 -
 53
53 -
 54
54 -
 55
55 -
 56
56 -
 57
57 -
 58
58 -
 59
59 -
 60
60 -
 61
61 -
62
-
63
-
64
-
65
-
66
-
67
-
68
-
69
-
70
-
71
-
72
-
73
-
74
-
75
-
76
-
77
-
78
-
79
-
80
-
81
-
82
-
83
-
84
-
85
-
86
-
87
-
88
-
89
-
90
-
91
-
92
-
93
-
94
-
95
-
96
-
97
-
98
-
99
-
100
-
101
-
102
-
103
-
104
-
105
-
106
-
107
-
108
-
109
-
110
-
111
-
112
-
113
-
114
-
115
-
116
-
117
-
118
 |
 |

45
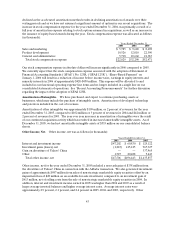
subsidiaries’ results in our financial statements. Minority interests in income from operations of
consolidated subsidiaries was approximately $8 million, $2 million, and $6 million for 2005, 2004, and 2003,
respectively. On November 23, 2005, we purchased the remaining outstanding shares of Yahoo! Europe
and Yahoo! Korea. Upon completion of this transaction, all of our consolidated subsidiaries were wholly-
owned by us and as a result we had no minority interest liability as of December 31, 2005. See Note 3 —
“Acquisitions” and Note 17 — “Subsequent Events” in the consolidated financial statements for additional
information.
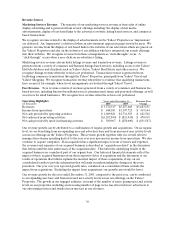
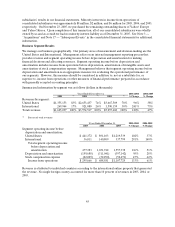
Business Segment Results
We manage our business geographically. Our primary areas of measurement and decision-making are the
United States and International. Management relies on an internal management reporting process that
provides revenue and segment operating income before depreciation and amortization for making
financial decisions and allocating resources. Segment operating income before depreciation and
amortization includes income from operations before depreciation, amortization of intangible assets and
amortization of stock compensation expense. Management believes that segment operating income before
depreciation and amortization is an appropriate measure for evaluating the operational performance of
our segments. However, this measure should be considered in addition to, not as a substitute for, or
superior to, income from operations or other measures of financial performance prepared in accordance
with generally accepted accounting principles.
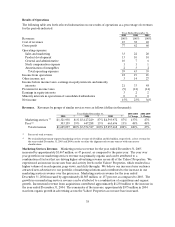
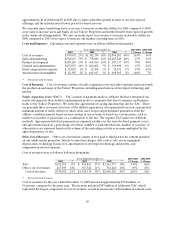
Summarized information by segment was as follows (dollars in thousands):
Years Ended December 31, 2003-2004 2004-2005
2003
(1) 2004 (1) 2005 (1) % Change % Change
Revenues by segment:
United States $ 1,355,153 83% $ 2,653,437 74% $ 3,667,509 70 % 96 % 38%
International 269,944 17% 921,080 26% 1,590,159 30 % 241 % 73%
Total revenues $ 1,625,097 100% $ 3,574,517 100% $ 5,257,668 100 % 120 % 47%
(1) Percent of total revenues.
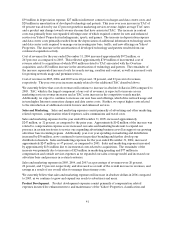
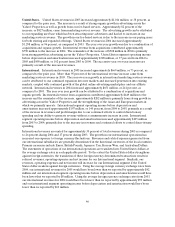
Years Ended December 31, 2003-2004 2004-2005
2003 2004 2005 % Change % Change
Segment operating income before
depreciation and amortization:
United States $ 441,372 $ 891,103 $ 1,219,539 102 % 37%
International 36,011 140,809 337,799 291 % 140%
Total segment operating income
before depreciation and
amortization 477,383 1,031,912 1,557,338 116 % 51%
Depreciation and amortization (159,688) (311,041) (397,142 ) 95 % 28%
Stock compensation expense (22,029) (32,290) (52,471 ) 47 % 62%
Income from operations $ 295,666 $ 688,581 $ 1,107,725 133 % 61%
Revenue is attributed to individual countries according to the international online property that generated
the revenue. No single foreign country accounted for more than 10 percent of revenues in 2005, 2004, or
2003.