Yahoo 2005 Annual Report Download - page 65
Download and view the complete annual report
Please find page 65 of the 2005 Yahoo annual report below. You can navigate through the pages in the report by either clicking on the pages listed below, or by using the keyword search tool below to find specific information within the annual report.-
 1
1 -
2
-
3
-
4
-
5
-
6
-
7
-
8
-
9
-
10
-
11
-
12
-
13
-
14
-
15
-
16
-
17
-
18
-
19
-
20
-
21
-
22
-
23
-
24
-
25
-
26
-
27
-
28
-
29
-
30
-
31
-
32
-
33
-
34
-
35
-
36
-
37
-
38
-
39
-
40
-
41
-
42
-
43
-
44
-
45
-
46
-
47
-
48
-
49
-
50
-
51
-
52
-
53
-
54
-
 55
55 -
 56
56 -
 57
57 -
 58
58 -
 59
59 -
 60
60 -
 61
61 -
 62
62 -
 63
63 -
 64
64 -
 65
65 -
 66
66 -
 67
67 -
 68
68 -
 69
69 -
 70
70 -
 71
71 -
 72
72 -
 73
73 -
 74
74 -
 75
75 -
76
-
77
-
78
-
79
-
80
-
81
-
82
-
83
-
84
-
85
-
86
-
87
-
88
-
89
-
90
-
91
-
92
-
93
-
94
-
95
-
96
-
97
-
98
-
99
-
100
-
101
-
102
-
103
-
104
-
105
-
106
-
107
-
108
-
109
-
110
-
111
-
112
-
113
-
114
-
115
-
116
-
117
-
118
 |
 |

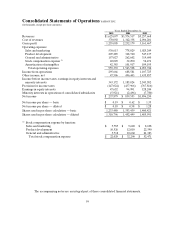
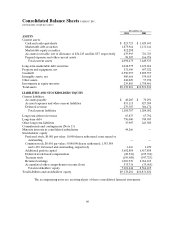
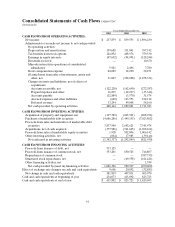
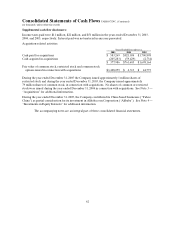
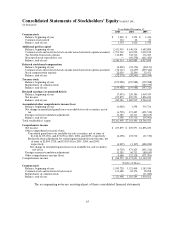
The accompanying notes are an integral part of these consolidated financial statements.
59
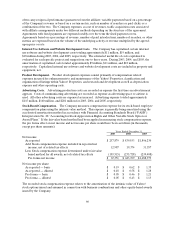
Consolidated Statements of Operations YAHOO! INC.
(in thousands, except per share amounts)
Years Ended December 31,
2003 2004 2005
Revenues $ 1,625,097 $ 3,574,517 $ 5,257,668
Cost of revenues 370,092 1,342,338 2,096,201
Gross profit 1,255,005 2,232,179 3,161,467
Operating expenses:
Sales and marketing 530,613 778,029 1,025,249
Product development 207,285 368,760 547,137
General and administrative 157,027 262,602 319,690
Stock compensation expense (1) 22,029 32,290 52,471
Amortization of intangibles 42,385 101,917 109,195
Total operating expenses 959,339 1,543,598 2,053,742
Income from operations 295,666 688,581 1,107,725
Other income, net 47,506 496,443 1,435,857
Income before income taxes, earnings in equity interests and
minority interests 343,172 1,185,024 2,543,582
Provision for income taxes (147,024) (437,966 ) (767,816)
Earnings in equity interests 47,652 94,991 128,244
Minority interests in operations of consolidated subsidiaries (5,921) (2,496 ) (7,780)
Net income $ 237,879 $ 839,553 $ 1,896,230
Net income per share — basic $ 0.19 $ 0.62 $ 1.35
Net income per share — diluted $ 0.18 $ 0.58 $ 1.28
Shares used in per share calculation — basic 1,233,480 1,353,439 1,400,421
Shares used in per share calculation — diluted 1,310,796 1,452,499 1,485,591
(1) Stock compensation expense by function:
Sales and marketing $ 5,785 $ 9,620 $ 8,698
Product development 10,526 12,010 22,390
General and administrative 5,718 10,660 21,383
Total stock compensation expense $ 22,029 $ 32,290 $ 52,471