Yahoo 2005 Annual Report Download - page 49
Download and view the complete annual report
Please find page 49 of the 2005 Yahoo annual report below. You can navigate through the pages in the report by either clicking on the pages listed below, or by using the keyword search tool below to find specific information within the annual report.-
 1
1 -
2
-
3
-
4
-
5
-
6
-
7
-
8
-
9
-
10
-
11
-
12
-
13
-
14
-
15
-
16
-
17
-
18
-
19
-
20
-
21
-
22
-
23
-
24
-
25
-
26
-
27
-
28
-
29
-
30
-
31
-
32
-
33
-
34
-
35
-
36
-
37
-
38
-
 39
39 -
 40
40 -
 41
41 -
 42
42 -
 43
43 -
 44
44 -
 45
45 -
 46
46 -
 47
47 -
 48
48 -
 49
49 -
 50
50 -
 51
51 -
 52
52 -
 53
53 -
 54
54 -
 55
55 -
 56
56 -
 57
57 -
 58
58 -
 59
59 -
60
-
61
-
62
-
63
-
64
-
65
-
66
-
67
-
68
-
69
-
70
-
71
-
72
-
73
-
74
-
75
-
76
-
77
-
78
-
79
-
80
-
81
-
82
-
83
-
84
-
85
-
86
-
87
-
88
-
89
-
90
-
91
-
92
-
93
-
94
-
95
-
96
-
97
-
98
-
99
-
100
-
101
-
102
-
103
-
104
-
105
-
106
-
107
-
108
-
109
-
110
-
111
-
112
-
113
-
114
-
115
-
116
-
117
-
118
 |
 |

43
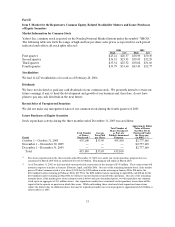
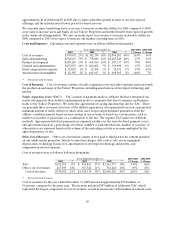
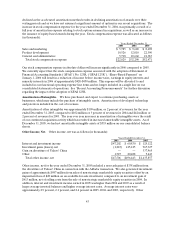
declined as the accelerated amortization method results in declining amortization of awards over their
vesting periods and as we have not assumed a significant amount of options in our recent acquisitions. The
increase in stock compensation expense for the year ended December 31, 2004, was primarily a result of a
full year of amortization expense relating to stock options assumed in acquisitions, as well as an increase in
the issuance of equity-based awards during the year. Stock compensation expense was allocated as follows
(in thousands):
Years Ended December 31,
2003 2004 2005
Sales and marketing $ 5,785 $ 9,620 $ 8,698
Product development 10,526 12,010 22,390
General and administrative 5,718 10,660 21,383
Total stock compensation expense $ 22,029 $ 32,290 $ 52,471
Our stock compensation expense in absolute dollars will increase significantly in 2006 compared to 2005.
We currently expect that the stock compensation expense associated with the adoption of Statement of
Financial Accounting Standards (“SFAS”) No. 123R, (“SFAS 123R”), “Share-Based Payment” on
January 1, 2006 will result in a reduction of income before income taxes, earnings in equity interests and
minority interests in 2006 of approximately $420-$450 million. This expense will be allocated to and
included in our functional operating expense line items and no longer included in a single line on our
consolidated statements of operations. See “Recent Accounting Pronouncements” for further discussion
regarding the impact of the adoption of SFAS 123R.
Amortization of Intangibles. We have purchased, and expect to continue purchasing, assets or
businesses, which may include the purchase of intangible assets. Amortization of developed technology
and patents is included in the cost of revenues.
Amortization of other intangibles was approximately $109 million, or 2 percent of revenues for the year
ended December 31, 2005, compared to $102 million or 3 percent of revenues for 2004 and $42 million or
2 percent of revenues for 2003. The year over year increases in amortization of intangibles were the result
of our continued acquisition activity which has resulted in increased amortizable intangible assets. As of
December 31, 2005, we had net amortizable intangible assets of $535 million on our consolidated balance
sheets.
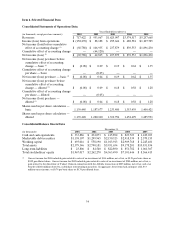
Other Income, Net. Other income, net was as follows (in thousands):
Years Ended December 31,
2003 2004 2005
Interest and investment income $ 47,202 $ 60,830 $ 125,122
Investment gains (losses), net (1,223) 415,125 967,327
Gain on divestiture of Yahoo! China — — 337,965
Other 1,527 20,488 5,443
Total other income, net $ 47,506 $ 496,443 $ 1,435,857
Other income, net for the year ended December 31, 2005 included a non-cash gain of $338 million from
the divestiture of Yahoo! China in connection with the Alibaba transaction. We also generated investment
gains of approximately $987 million from sales of non-strategic marketable equity securities offset by an
impairment loss of $28 million on an available-for-sale investment, compared to an investment gain of
$413 million, net of selling costs from the sale of non-strategic marketable equity securities in 2004. In
addition, interest and investment income earned in 2005 was higher than 2004 and 2003 as a result of
larger average invested balances and higher average interest rates. Average interest rates were
approximately 2.9 percent, 2.1 percent, and 2.4 percent in 2005, 2004, and 2003, respectively. Other