Yahoo 2005 Annual Report Download - page 47
Download and view the complete annual report
Please find page 47 of the 2005 Yahoo annual report below. You can navigate through the pages in the report by either clicking on the pages listed below, or by using the keyword search tool below to find specific information within the annual report.-
 1
1 -
2
-
3
-
4
-
5
-
6
-
7
-
8
-
9
-
10
-
11
-
12
-
13
-
14
-
15
-
16
-
17
-
18
-
19
-
20
-
21
-
22
-
23
-
24
-
25
-
26
-
27
-
28
-
29
-
30
-
31
-
32
-
33
-
34
-
35
-
36
-
 37
37 -
 38
38 -
 39
39 -
 40
40 -
 41
41 -
 42
42 -
 43
43 -
 44
44 -
 45
45 -
 46
46 -
 47
47 -
 48
48 -
 49
49 -
 50
50 -
 51
51 -
 52
52 -
 53
53 -
 54
54 -
 55
55 -
 56
56 -
 57
57 -
58
-
59
-
60
-
61
-
62
-
63
-
64
-
65
-
66
-
67
-
68
-
69
-
70
-
71
-
72
-
73
-
74
-
75
-
76
-
77
-
78
-
79
-
80
-
81
-
82
-
83
-
84
-
85
-
86
-
87
-
88
-
89
-
90
-
91
-
92
-
93
-
94
-
95
-
96
-
97
-
98
-
99
-
100
-
101
-
102
-
103
-
104
-
105
-
106
-
107
-
108
-
109
-
110
-
111
-
112
-
113
-
114
-
115
-
116
-
117
-
118
 |
 |
41
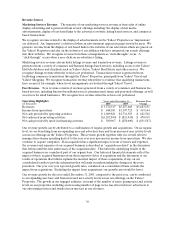
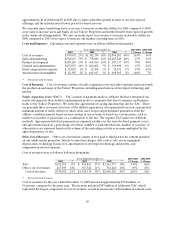
$39 million in depreciation expense, $27 million in Internet connection charges and data center costs, and
$20 million in amortization of developed technology and patents. This year over year increase in TAC of
60 percent was driven by our 47 percent growth in marketing services revenue, higher average TAC rates
and a product mix change toward revenue streams that have associated TAC. The increase in content
costs was primarily from our expanded offerings some of which required content for new and enhanced
services on Yahoo! Properties including music, sports, and games. The increase in depreciation expense
and data center costs primarily resulted from the depreciation of additional information technology assets
and data center costs required to manage our increasing user base, traffic, and new offerings on Yahoo!
Properties. The increase in the amortization of developed technology and patents resulted from our
continued acquisition activity.
Cost of revenues for the year ended December 31, 2004 increased approximately $972 million, or
263 percent, as compared to 2003. This reflected approximately $769 million of incremental cost of
revenue related to acquisitions of which $703 million related to TAC associated with the Overture
acquisition, and a $32 million increase in the amortization of technology and patents. The remainder of
the increase represented increased costs for search serving, royalties and content, as well as increased costs
for growing network usage and premium services.
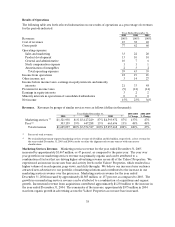
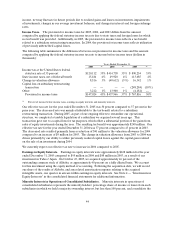
Cost of revenues in 2005, 2004, and 2003 were 40 percent, 38 percent, and 23 percent of revenues,
respectively. The year over year increases mainly related to the additional TAC described above.
We currently believe that cost of revenues will continue to increase in absolute dollars in 2006 compared to
2005. TAC, which is the largest component of our cost of revenues, is expected to increase as our
marketing services revenue increases and as TAC rates increase in the competitive search market.
Additionally, we expect to continue to increase our user base and offerings, which drive network usage and
in turn higher Internet connection charges and data center costs. Further, we expect higher costs related
to the introduction of additional content for new and enhanced services.
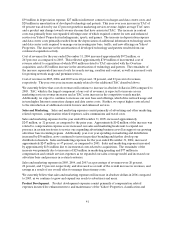
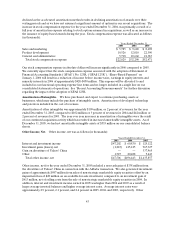
Sales and Marketing. Sales and marketing expenses consist primarily of advertising and other marketing
related expenses, compensation related expenses, sales commissions and travel costs.
Sales and marketing expenses for the year ended December 31, 2005, increased approximately
$247 million, or 32 percent, as compared to the prior year. Approximately $142 million of the increase was
related to compensation expense as we increased our sales and marketing headcount to expand our
presence in certain territories to service our expanding advertising business as well as support our growing
advertiser base in existing regions. Additionally, year over year spending on marketing and distribution
increased by $56 million, as we continued to invest in product branding and further develop our
distribution channels. Sales and marketing expenses for the year ended December 31, 2004, increased
approximately $247 million, or 47 percent, as compared to 2003. Sales and marketing expenses increased
by approximately $136 million due to incremental costs related to acquisitions. The remainder of the
increase was primarily due to increases of $25 million in marketing spending and $77 million in
compensation and outside services expenses as we expanded our sales coverage model and increased our
advertiser base and presence in certain territories.
Sales and marketing expenses in 2005, 2004, and 2003 as a percentage of revenues were 20 percent,
22 percent, and 33 percent, respectively, and decreased as a result of the overall increase in revenues, and
savings as a result of our overall effort to manage discretionary costs.
We currently believe that sales and marketing expenses will increase in absolute dollars in 2006 compared
to 2005, as we continue to grow and expand our reach to advertisers and users.
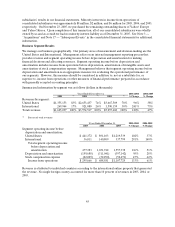
Product Development. Product development expenses consist primarily of compensation related
expenses incurred for enhancements to and maintenance of the Yahoo! Properties, classification and