Yahoo 2005 Annual Report Download - page 96
Download and view the complete annual report
Please find page 96 of the 2005 Yahoo annual report below. You can navigate through the pages in the report by either clicking on the pages listed below, or by using the keyword search tool below to find specific information within the annual report.-
 1
1 -
2
-
3
-
4
-
5
-
6
-
7
-
8
-
9
-
10
-
11
-
12
-
13
-
14
-
15
-
16
-
17
-
18
-
19
-
20
-
21
-
22
-
23
-
24
-
25
-
26
-
27
-
28
-
29
-
30
-
31
-
32
-
33
-
34
-
35
-
36
-
37
-
38
-
39
-
40
-
41
-
42
-
43
-
44
-
45
-
46
-
47
-
48
-
49
-
50
-
51
-
52
-
53
-
54
-
55
-
56
-
57
-
58
-
59
-
60
-
61
-
62
-
63
-
64
-
65
-
66
-
67
-
68
-
69
-
70
-
71
-
72
-
73
-
74
-
75
-
76
-
77
-
78
-
79
-
80
-
81
-
82
-
83
-
84
-
85
-
 86
86 -
 87
87 -
 88
88 -
 89
89 -
 90
90 -
 91
91 -
 92
92 -
 93
93 -
 94
94 -
 95
95 -
 96
96 -
 97
97 -
 98
98 -
 99
99 -
 100
100 -
 101
101 -
 102
102 -
 103
103 -
 104
104 -
 105
105 -
 106
106 -
107
-
108
-
109
-
110
-
111
-
112
-
113
-
114
-
115
-
116
-
117
-
118
 |
 |

90
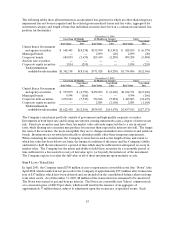
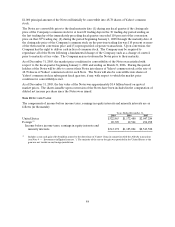
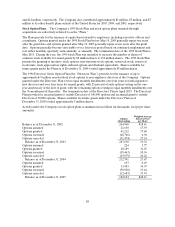
stock compensation expense relates to the amortization of the intrinsic value of Yahoo! stock options
issued and assumed in connection with business combinations and other equity-based awards issued by the
Company. This expense is generally being amortized using the accelerated amortization method in
accordance with FASB Interpretation No. 28 “Accounting for Stock Appreciation Rights and Other
Variable Stock Option or Award Plans.” As of December 31, 2005, approximately $235 million remains to
be amortized over the remaining vesting periods of the options and restricted stock awards when
calculated using the intrinsic value method. This amount is not reflective of the future total stock-based
compensation expense that will be recorded using the fair value based method for options that will vest in
the future. If the fair value based method had been applied in measuring stock compensation expense, the
pro forma effect on net income and net income per share would have been as follows (in thousands, except
per share amounts):
Years Ended December 31,
2003
(1)(2) 2004
(1) 2005
(1)
Net income:
As reported $ 237,879 $ 839,553 $ 1,896,230
Add: Stock compensation expense included in reported net
income, net of related tax effects 12,987 19,374 31,557
Less: Stock compensation expense determined under fair value
based method for all awards, net of related tax effects (183,515) (235,728 ) (239,408)
Pro forma net income $ 67,351 $ 623,199 $ 1,688,379
Net income per share:
As reported — basic $ 0.19 $ 0.62 $ 1.35
As reported — diluted $ 0.18 $ 0.58 $ 1.28
Pro forma — basic $ 0.05 $ 0.46 $ 1.21
Pro forma — diluted $ 0.05 $ 0.43 $ 1.13
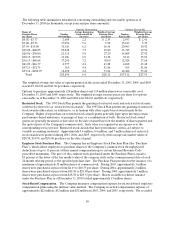
The Black-Scholes option valuation model was developed for use in estimating the fair value of traded
options that have no vesting restrictions and are fully transferable. In addition, option valuation models
require the input of highly subjective assumptions, including the expected stock price volatility. Because
additional stock options are expected to be granted each year, the pro forma disclosures are not
representative of pro forma effects on reported financial results for future years. The fair value of option
grants is determined using the Black-Scholes option pricing model with the following weighted average
assumptions:
Years Ended December 31,
2003 2004 2005
Expected dividend yield 0.0% 0.0 % 0.0%
Risk-free interest rate ranges 1.5% - 2.5% 2.2% - 3.1 % 3.7% - 4.6%
Expected volatility (1) 62% 50 % 35%
Expected life (in years) (2) 3.0 3.5 3.8
(1) Up to September 30, 2005, the Company used an equally weighted average of trailing volatility and market based implied
volatility for the computation. Since October 1, 2005 the Company began exclusively using market based implied volatility for
the computation.
(2) For the year ended December 31, 2003 the stock compensation expense amounts have been adjusted to reflect lower calculated
fair values for employee stock options, which resulted in an increase of $33 million ($0.02 per share) in the pro forma net
income. This adjustment was required as the Company’s estimate of the fair value of employee stock options was incorrectly
based on a five-and-one-half year expected life rather than the three year expected life intended by management.