Yahoo 2005 Annual Report Download - page 52
Download and view the complete annual report
Please find page 52 of the 2005 Yahoo annual report below. You can navigate through the pages in the report by either clicking on the pages listed below, or by using the keyword search tool below to find specific information within the annual report.-
 1
1 -
2
-
3
-
4
-
5
-
6
-
7
-
8
-
9
-
10
-
11
-
12
-
13
-
14
-
15
-
16
-
17
-
18
-
19
-
20
-
21
-
22
-
23
-
24
-
25
-
26
-
27
-
28
-
29
-
30
-
31
-
32
-
33
-
34
-
35
-
36
-
37
-
38
-
39
-
40
-
41
-
 42
42 -
 43
43 -
 44
44 -
 45
45 -
 46
46 -
 47
47 -
 48
48 -
 49
49 -
 50
50 -
 51
51 -
 52
52 -
 53
53 -
 54
54 -
 55
55 -
 56
56 -
 57
57 -
 58
58 -
 59
59 -
 60
60 -
 61
61 -
 62
62 -
63
-
64
-
65
-
66
-
67
-
68
-
69
-
70
-
71
-
72
-
73
-
74
-
75
-
76
-
77
-
78
-
79
-
80
-
81
-
82
-
83
-
84
-
85
-
86
-
87
-
88
-
89
-
90
-
91
-
92
-
93
-
94
-
95
-
96
-
97
-
98
-
99
-
100
-
101
-
102
-
103
-
104
-
105
-
106
-
107
-
108
-
109
-
110
-
111
-
112
-
113
-
114
-
115
-
116
-
117
-
118
 |
 |
46
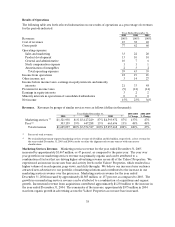
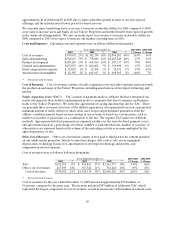
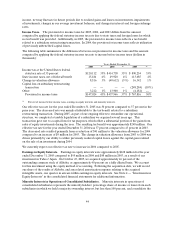
United States. United States revenues in 2005 increased approximately $1,014 million, or 38 percent, as
compared to the prior year. The increase is a result of strong organic growth in advertising across the
Yahoo! Properties as well as growth from our fee-based services. Approximately 82 percent of the
increase, or $827 million, came from marketing services revenue. The advertising growth can be attributed
to our expanding user base which has been attracting more advertisers and has led to increases in our
marketing services revenue. The growth in our fee-based services is due to the increase in our paying users
for both existing and expanded offerings. United States revenues in 2004 increased approximately
$1,298 million, or 96 percent, as compared to 2003. The year over year growth was due to a combination of
acquisitions and organic growth. Incremental revenue from acquisitions contributed approximately
$790 million to the increase in 2004. The remainder of the increase of $508 million in 2004 is primarily
from strong growth in advertising across the Yahoo! Properties. United States segment operating income
before depreciation and amortization increased approximately $328 million, or 37 percent from 2004 to
2005 and $450 million, or 102 percent from 2003 to 2004. The successive year over year increases are
primarily a result of the increased revenues.
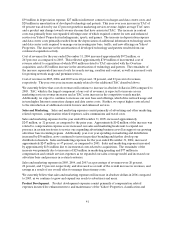
International. International revenues in 2005 increased approximately $669 million, or 73 percent, as
compared to the prior year. More than 95 percent of the international revenue increase came from
marketing services revenue in 2005. The year over year growth in international marketing services revenue
can be attributed to our continued expansion into new markets and increased penetration into existing
markets, coupled with continued growth of the global online advertising marketplace and our affiliate
network. International revenues in 2004 increased approximately $651 million, or 241 percent, as
compared to 2003. The year over year growth can be attributed to a combination of acquisitions and
organic growth. Incremental revenue from acquisitions contributed approximately $449 million to the
increase and the remainder of the increase, approximately $202 million is primarily from strong growth in
advertising across the Yahoo! Properties and the strengthening of the Asian and European markets in
which we primarily operate. International segment operating income before depreciation and
amortization increased approximately $197 million, or 140 percent, from 2004 to 2005, primarily as a result
of the increase in revenues and profit margin due to our continued efforts to control discretionary
spending and our ability to generate revenue without a commensurate increase in costs. International
segment operating income before depreciation and amortization increased approximately $105 million
from 2003 to 2004, primarily due to the increase in revenues and continued efforts to control discretionary
spending.
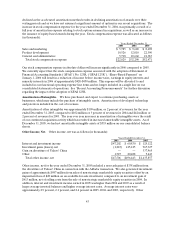
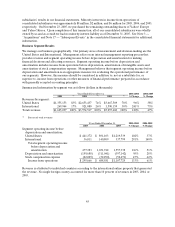
International revenues accounted for approximately 30 percent of total revenues during 2005 as compared
to 26 percent during 2004 and 17 percent during 2003. The growth in our international operations has
increased our exposure to foreign currency fluctuations. Revenues and related expenses generated from
our international subsidiaries are generally denominated in the functional currencies of the local countries.
Primary currencies include Euros, British Pounds, Japanese Yen, Korean Won, and Australian Dollars.
The statements of operations of our international operations are translated into United States dollars at
the average exchange rates in each applicable period. To the extent the United States dollar strengthens
against foreign currencies, the translation of these foreign currency denominated transactions results in
reduced revenues, operating expenses and net income for our International segment. Similarly, our
revenues, operating expenses and net income will increase for our International segment if the United
States dollar weakens against foreign currencies. Using the average foreign currency exchange rates from
2004, our international revenues for 2005 would have been lower than we reported by approximately $42
million and our international segment operating income before depreciation and amortization would have
been lower that we reported by $8 million. Using the average foreign currency exchange rates from 2003,
our international revenues for 2004 would have been lower than we reported by approximately $59 million
and our international segment operating income before depreciation and amortization would have been
lower than we reported by $10 million.