Yahoo 2005 Annual Report Download - page 69
Download and view the complete annual report
Please find page 69 of the 2005 Yahoo annual report below. You can navigate through the pages in the report by either clicking on the pages listed below, or by using the keyword search tool below to find specific information within the annual report.-
 1
1 -
2
-
3
-
4
-
5
-
6
-
7
-
8
-
9
-
10
-
11
-
12
-
13
-
14
-
15
-
16
-
17
-
18
-
19
-
20
-
21
-
22
-
23
-
24
-
25
-
26
-
27
-
28
-
29
-
30
-
31
-
32
-
33
-
34
-
35
-
36
-
37
-
38
-
39
-
40
-
41
-
42
-
43
-
44
-
45
-
46
-
47
-
48
-
49
-
50
-
51
-
52
-
53
-
54
-
55
-
56
-
57
-
58
-
 59
59 -
 60
60 -
 61
61 -
 62
62 -
 63
63 -
 64
64 -
 65
65 -
 66
66 -
 67
67 -
 68
68 -
 69
69 -
 70
70 -
 71
71 -
 72
72 -
 73
73 -
 74
74 -
 75
75 -
 76
76 -
 77
77 -
 78
78 -
 79
79 -
80
-
81
-
82
-
83
-
84
-
85
-
86
-
87
-
88
-
89
-
90
-
91
-
92
-
93
-
94
-
95
-
96
-
97
-
98
-
99
-
100
-
101
-
102
-
103
-
104
-
105
-
106
-
107
-
108
-
109
-
110
-
111
-
112
-
113
-
114
-
115
-
116
-
117
-
118
 |
 |

63
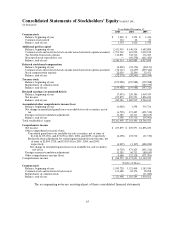
Consolidated Statements of Stockholders’ Equity YAHOO! INC.
(in thousands)
Years Ended December 31,
2003 2004 2005
Common stock
Balance, beginning of year $ 1,222 $ 1,354 $ 1,416
Common stock issued 132 62 54
Balance, end of year 1,354 1,416 1,470
Additional paid-in capital
Balance, beginning of year 2,431,903 4,340,514 5,682,884
Common stock and restricted stock awards issued and stock options assumed 1,791,760 667,212 1,010,012
Tax benefits from stock options 116,851 744,716 336,383
Structured stock repurchases, net — (69,558 ) (611,421)
Balance, end of year 4,340,514 5,682,884 6,417,858
Deferred stock-based compensation
Balance, beginning of year (2,292 ) (52,374 ) (28,541)
Common stock and restricted stock awards issued and stock options assumed (72,111 ) (8,457 ) (259,324)
Stock compensation expense 22,029 32,290 52,471
Balance, end of year (52,374 ) (28,541 ) (235,394)
Treasury stock
Balance, beginning of year (159,988 ) (159,988 ) (159,988)
Repurchases of common stock — — (387,735)
Balance, end of year (159,988 ) (159,988 ) (547,723)
Retained earnings (accumulated deficit)
Balance, beginning of year (7,493 ) 230,386 1,069,939
Net income 237,879 839,553 1,896,230
Balance, end of year 230,386 1,069,939 2,966,169
Accumulated other comprehensive income (loss)
Balance, beginning of year (1,082 ) 3,598 535,736
Net change in unrealized gains/losses on available-for-sale securities, net of
tax (6,705 ) 471,425 (491,532)
Foreign currency translation adjustment 11,385 60,713 (80,169)
Balance, end of year 3,598 535,736 (35,965)
Total stockholders’ equity $ 4,363,490 $ 7,101,446 $ 8,566,415
Comprehensive income
Net income $ 237,879 $ 839,553 $ 1,896,230
Other comprehensive income (loss):
Unrealized gains/losses on available-for-sale securities, net of taxes of
$1,642, $(315,001), and $7,669 for 2003, 2004, and 2005, respectively (2,498 ) 472,532 (11,510)
Reclassification adjustment for realized gains included in net income, net
of taxes of $2,804, $738, and $320,015 for 2003, 2004, and 2005,
respectively (4,207 ) (1,107 ) (480,022)
Net change in unrealized gains (losses) on available-for-sale securities,
net of tax (6,705 ) 471,425 (491,532)
Foreign currency translation adjustment 11,385 60,713 (80,169)
Other comprehensive income (loss) 4,680 532,138 (571,701)
Comprehensive income $ 242,559 $ 1,371,691 $ 1,324,529
Number of Shares
Common stock
Balance, beginning of year 1,189,720 1,321,408 1,383,584
Common stock and restricted stock issued 131,688 62,176 58,258
Repurchases of common stock — — (11,680)
Balance, end of year 1,321,408 1,383,584 1,430,162
The accompanying notes are an integral part of these consolidated financial statements.