Yahoo 2005 Annual Report Download - page 61
Download and view the complete annual report
Please find page 61 of the 2005 Yahoo annual report below. You can navigate through the pages in the report by either clicking on the pages listed below, or by using the keyword search tool below to find specific information within the annual report.-
 1
1 -
2
-
3
-
4
-
5
-
6
-
7
-
8
-
9
-
10
-
11
-
12
-
13
-
14
-
15
-
16
-
17
-
18
-
19
-
20
-
21
-
22
-
23
-
24
-
25
-
26
-
27
-
28
-
29
-
30
-
31
-
32
-
33
-
34
-
35
-
36
-
37
-
38
-
39
-
40
-
41
-
42
-
43
-
44
-
45
-
46
-
47
-
48
-
49
-
50
-
 51
51 -
 52
52 -
 53
53 -
 54
54 -
 55
55 -
 56
56 -
 57
57 -
 58
58 -
 59
59 -
 60
60 -
 61
61 -
 62
62 -
 63
63 -
 64
64 -
 65
65 -
 66
66 -
 67
67 -
 68
68 -
 69
69 -
 70
70 -
 71
71 -
72
-
73
-
74
-
75
-
76
-
77
-
78
-
79
-
80
-
81
-
82
-
83
-
84
-
85
-
86
-
87
-
88
-
89
-
90
-
91
-
92
-
93
-
94
-
95
-
96
-
97
-
98
-
99
-
100
-
101
-
102
-
103
-
104
-
105
-
106
-
107
-
108
-
109
-
110
-
111
-
112
-
113
-
114
-
115
-
116
-
117
-
118
 |
 |
55
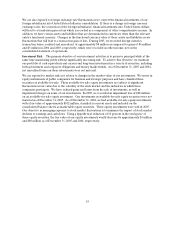
We are also exposed to foreign exchange rate fluctuations as we convert the financial statements of our
foreign subsidiaries into United States dollars in consolidation. If there is a change in foreign currency
exchange rates, the conversion of the foreign subsidiaries’ financial statements into United States dollars
will lead to a translation gain or loss which is recorded as a component of other comprehensive income. In
addition, we have certain assets and liabilities that are denominated in currencies other than the relevant
entity’s functional currency. Changes in the functional currency value of these assets and liabilities create
fluctuations that will lead to a transaction gain or loss. During 2005, we recorded foreign currency
transaction losses, realized and unrealized, of approximately $8 million as compared to gains of $6 million
and $3 million in 2004 and 2003, respectively, which were recorded in other income, net on the
consolidated statement of operations.
Investment Risk. The primary objective of our investment activities is to preserve principal while at the
same time maximizing yields without significantly increasing risk. To achieve this objective, we maintain
our portfolio of cash equivalents and current and long-term investments in a variety of securities, including
both government and corporate obligations and money market funds. As of December 31, 2005 and 2004,
net unrealized losses on these investments were not material.
We are exposed to market risk as it relates to changes in the market value of our investments. We invest in
equity instruments of public companies for business and strategic purposes and have classified these
securities as available-for-sale. These available-for-sale equity investments are subject to significant
fluctuations in fair value due to the volatility of the stock market and the industries in which these
companies participate. We have realized gains and losses from the sale of investments, as well as
impairment charges on some of our investments. In 2005, we recorded an impairment loss of $28 million
on an available-for-sale equity investment. Our investments in available-for-sale equity securities were not
material as of December 31, 2005. As of December 31, 2004, we had available-for-sale equity investments
with a fair value of approximately $812 million, classified as current assets and included on the
consolidated balance sheets as marketable equity securities. These equity investments were sold in 2005.
Our objective in managing exposure to stock market fluctuations is to minimize the impact of stock market
declines to earnings and cash flows. Using a hypothetical reduction of 10 percent in the stock price of
these equity securities, the fair value of our equity investments would decrease by approximately $3 million
and $80 million as of December 31, 2005 and 2004, respectively.