Yahoo 2005 Annual Report Download - page 88
Download and view the complete annual report
Please find page 88 of the 2005 Yahoo annual report below. You can navigate through the pages in the report by either clicking on the pages listed below, or by using the keyword search tool below to find specific information within the annual report.-
 1
1 -
2
-
3
-
4
-
5
-
6
-
7
-
8
-
9
-
10
-
11
-
12
-
13
-
14
-
15
-
16
-
17
-
18
-
19
-
20
-
21
-
22
-
23
-
24
-
25
-
26
-
27
-
28
-
29
-
30
-
31
-
32
-
33
-
34
-
35
-
36
-
37
-
38
-
39
-
40
-
41
-
42
-
43
-
44
-
45
-
46
-
47
-
48
-
49
-
50
-
51
-
52
-
53
-
54
-
55
-
56
-
57
-
58
-
59
-
60
-
61
-
62
-
63
-
64
-
65
-
66
-
67
-
68
-
69
-
70
-
71
-
72
-
73
-
74
-
75
-
76
-
77
-
 78
78 -
 79
79 -
 80
80 -
 81
81 -
 82
82 -
 83
83 -
 84
84 -
 85
85 -
 86
86 -
 87
87 -
 88
88 -
 89
89 -
 90
90 -
 91
91 -
 92
92 -
 93
93 -
 94
94 -
 95
95 -
 96
96 -
 97
97 -
 98
98 -
99
-
100
-
101
-
102
-
103
-
104
-
105
-
106
-
107
-
108
-
109
-
110
-
111
-
112
-
113
-
114
-
115
-
116
-
117
-
118
 |
 |

82
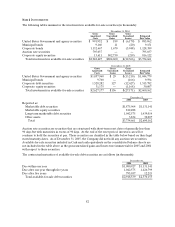
Note 8 INVESTMENTS
The following tables summarize the investments in available-for-sale securities (in thousands):
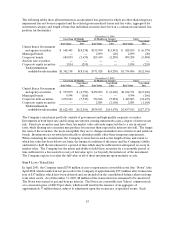
December 31, 2004
Gross
Amortized
Costs
Gross
Unrealized
Gains
Gross
Unrealized
Losses
Estimated
Fair Value
United States Government and agency securities $ 991,952 $ 189 $ (6,179 ) $ 985,962
Municipal bonds 9,160 11 (20 ) 9,151
Corporate bonds 1,132,667 1,670 (5,948 ) 1,128,389
Auction rate securities 795,037 — — 795,037
Corporate equity securities 13,611 802,730 (219 ) 816,122
Total investments in available-for-sale securities $ 2,942,427 $ 804,600 $ (12,366 ) $ 3,734,661
December 31, 2005
Gross
Amortized
Costs
Gross
Unrealized
Gains
Gross
Unrealized
Losses
Estimated
Fair Value
United States Government and agency securities $ 1,057,960 $ 29 $ (13,210 ) $ 1,044,779
Municipal bonds 9,760 — (166 ) 9,594
Corporate debt securities 1,528,282 127 (12,627 ) 1,515,782
Corporate equity securities 31,175 — (1,168 ) 30,007
Total investments in available-for-sale securities $ 2,627,177 $ 156 $ (27,171 ) $ 2,600,162
December 31,
2004 2005
Reported as:
Marketable debt securities $1,875,964 $1,131,141
Marketable equity securities 812,288 —
Long-term marketable debt securities 1,042,575 1,439,014
Other assets 3,834 30,007
Total $3,734,661 $2,600,162
Auction rate securities are securities that are structured with short-term reset dates of generally less than
90 days but with maturities in excess of 90 days. At the end of the reset period, investors can sell or
continue to hold the securities at par. These securities are classified in the table below based on their legal
stated maturity dates. As of December 31, 2005, the Company did not hold any auction rate securities.
Available-for-sale securities included in Cash and cash equivalents on the consolidated balance sheets are
not included in the table above as the gross unrealized gains and losses were immaterial for 2005 and 2004
with respect to these securities.
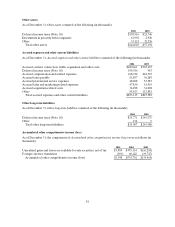
The contractual maturities of available-for-sale debt securities are as follows (in thousands):
December 31,
2004 2005
Due within one year $ 1,080,927 $ 1,131,141
Due after one year through five years 1,042,575 1,426,799
Due after five years 795,037 12,215
Total available-for-sale debt securities $ 2,918,539 $ 2,570,155