Yahoo 2005 Annual Report Download - page 42
Download and view the complete annual report
Please find page 42 of the 2005 Yahoo annual report below. You can navigate through the pages in the report by either clicking on the pages listed below, or by using the keyword search tool below to find specific information within the annual report.-
 1
1 -
2
-
3
-
4
-
5
-
6
-
7
-
8
-
9
-
10
-
11
-
12
-
13
-
14
-
15
-
16
-
17
-
18
-
19
-
20
-
21
-
22
-
23
-
24
-
25
-
26
-
27
-
28
-
29
-
30
-
31
-
 32
32 -
 33
33 -
 34
34 -
 35
35 -
 36
36 -
 37
37 -
 38
38 -
 39
39 -
 40
40 -
 41
41 -
 42
42 -
 43
43 -
 44
44 -
 45
45 -
 46
46 -
 47
47 -
 48
48 -
 49
49 -
 50
50 -
 51
51 -
 52
52 -
53
-
54
-
55
-
56
-
57
-
58
-
59
-
60
-
61
-
62
-
63
-
64
-
65
-
66
-
67
-
68
-
69
-
70
-
71
-
72
-
73
-
74
-
75
-
76
-
77
-
78
-
79
-
80
-
81
-
82
-
83
-
84
-
85
-
86
-
87
-
88
-
89
-
90
-
91
-
92
-
93
-
94
-
95
-
96
-
97
-
98
-
99
-
100
-
101
-
102
-
103
-
104
-
105
-
106
-
107
-
108
-
109
-
110
-
111
-
112
-
113
-
114
-
115
-
116
-
117
-
118
 |
 |

36
Revenue Sources
Marketing Services Revenue. The majority of our marketing services revenue is from sales of online
display advertising and is generated from several offerings including: the display of rich media
advertisements, display of text based links to the advertiser’s website, listing based services, and commerce
based transactions.
We recognize revenue related to the display of advertisements on the Yahoo! Properties as “impressions”
are delivered. An “impression” is delivered when an advertisement appears in pages viewed by users. We
generate revenue from the display of text based links to the websites of our advertisers which are placed on
the Yahoo! Properties and also on the websites of our affiliates who have integrated our search offerings
into their websites. We recognize revenue from these arrangements as “click-throughs” occur. A
“click-through” occurs when a user clicks on an advertiser’s listing.
Marketing services revenue also includes listings revenue and transaction revenue. Listings revenue is
generated from a variety of consumer and business listings-based services, including access to the Yahoo!
HotJobs database and classifieds such as Yahoo! Autos, Yahoo! Real Estate and other services. We
recognize listings revenue when the services are performed. Transaction revenue is generated from
facilitating commerce transactions through the Yahoo! Properties, principally from Yahoo! Travel and
Yahoo! Shopping. We recognize transaction revenue when there is evidence that qualifying transactions
have occurred, for example, when travel arrangements are booked through Yahoo! Travel.
Fees Revenue. Fees revenue consists of revenues generated from a variety of consumer and business fee-
based services, including Internet broadband services, premium mail, music and personals offerings, as well
as services for small businesses. We recognize fees revenue when the services are performed.
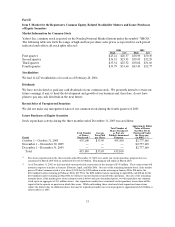
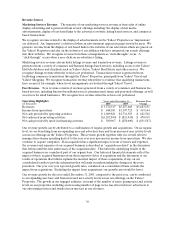
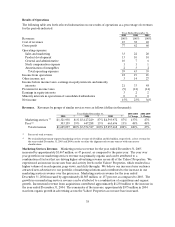
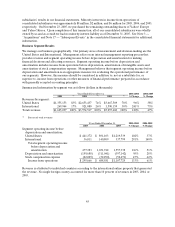
Operating Highlights Years ended December 31, Year over Year
(in thousands) 2004 2005 Change
Revenues $ 3,574,517 $ 5,257,668 $ 1,683,151
Income from operations $ 688,581 $ 1,107,725 $ 419,144
Net cash provided by operating activities $ 1,089,821 $ 1,711,383 $ 621,562
Net cash used in investing activities $ (1,292,849) $ (821,930 ) $ 470,919
Net cash provided by (used in) financing activities $ 580,967 $ (250,600 ) $ (831,567)
Our revenue growth can be attributed to a combination of organic growth and acquisitions. On an organic
level, we are benefiting from an expanding user and advertiser base and from increased user activity levels
across our offerings on the Yahoo! Properties. This revenue growth together with our overall effort to
manage discretionary spending has led to the year over year increases in income from operations. We also
continue to acquire companies. If an acquisition has a significant impact on our revenues and expenses,
the revenues and expenses of our acquired business is described as “acquisition related” in the discussion
that follows until the first anniversary of the acquisition date. Thereafter the underlying results of the
acquired business are considered part of our organic base. Our historical financial statements reflect the
impact of these acquired businesses from their respective dates of acquisition and the discussion of our
results of operations that follows explains the material impact of these acquisitions, if any, on our
consolidated results to provide information that will assist in understanding the changes in the years
presented. Our year over year reported growth rates, calculated on a consolidated basis, include the
impact from acquisitions. Excluding the impact from acquisitions, our growth rates would be lower.
Our revenue growth for the year ended December 31, 2005, compared to the prior year, can be attributed
to an expanding user base and from increased user activity levels across our offerings on the Yahoo!
Properties. The growth in our engaged audience, in terms of the number of users, paying users and activity
levels on our properties, including an increasing number of page views, has attracted more advertisers to
our advertising services and resulted in an increase in our revenues.