Yahoo 2005 Annual Report Download - page 40
Download and view the complete annual report
Please find page 40 of the 2005 Yahoo annual report below. You can navigate through the pages in the report by either clicking on the pages listed below, or by using the keyword search tool below to find specific information within the annual report.-
 1
1 -
2
-
3
-
4
-
5
-
6
-
7
-
8
-
9
-
10
-
11
-
12
-
13
-
14
-
15
-
16
-
17
-
18
-
19
-
20
-
21
-
22
-
23
-
24
-
25
-
26
-
27
-
28
-
29
-
 30
30 -
 31
31 -
 32
32 -
 33
33 -
 34
34 -
 35
35 -
 36
36 -
 37
37 -
 38
38 -
 39
39 -
 40
40 -
 41
41 -
 42
42 -
 43
43 -
 44
44 -
 45
45 -
 46
46 -
 47
47 -
 48
48 -
 49
49 -
 50
50 -
51
-
52
-
53
-
54
-
55
-
56
-
57
-
58
-
59
-
60
-
61
-
62
-
63
-
64
-
65
-
66
-
67
-
68
-
69
-
70
-
71
-
72
-
73
-
74
-
75
-
76
-
77
-
78
-
79
-
80
-
81
-
82
-
83
-
84
-
85
-
86
-
87
-
88
-
89
-
90
-
91
-
92
-
93
-
94
-
95
-
96
-
97
-
98
-
99
-
100
-
101
-
102
-
103
-
104
-
105
-
106
-
107
-
108
-
109
-
110
-
111
-
112
-
113
-
114
-
115
-
116
-
117
-
118
 |
 |

34
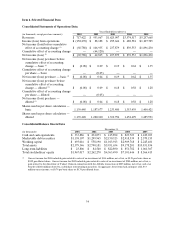
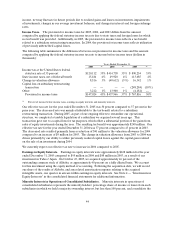
Item 6. Selected Financial Data
Consolidated Statements of Operations Data:
Years Ended December 31,
(in thousands, except per share amounts) 2001 2002 2003 2004 2005
Revenues $ 717,422 $ 953,067 $ 1,625,097 $ 3,574,517 $ 5,257,668
Income (loss) from operations $ (158,270) $ 88,188 $ 295,666 $ 688,581 $ 1,107,725
Net income (loss) before cumulative
effect of accounting change (1) $ (92,788) $ 106,935 $ 237,879 $ 839,553 $ 1,896,230
Cumulative effect of accounting change — (64,120) — — —
Net income (loss) (1) $ (92,788) $ 42,815 $ 237,879 $ 839,553 $ 1,896,230
Net income (loss) per share before
cumulative effect of accounting
change — basic (1) $ (0.08) $ 0.09 $ 0.19 $ 0.62 $ 1.35
Cumulative effect of accounting change
per share — basic — (0.05) — — —
Net income (loss) per share — basic (1) $ (0.08) $ 0.04 $ 0.19 $ 0.62 $ 1.35
Net income (loss) per share before
cumulative effect of accounting
change — diluted (1) $ (0.08) $ 0.09 $ 0.18 $ 0.58 $ 1.28
Cumulative effect of accounting change
per share — diluted — (0.05) — — —
Net income (loss) per share —
diluted (1) $ (0.08) $ 0.04 $ 0.18 $ 0.58 $ 1.28
Shares used in per share calculation —
basic 1,139,448 1,187,677 1,233,480 1,353,439 1,400,421
Shares used in per share calculation —
diluted 1,139,448 1,220,120 1,310,796 1,452,499 1,485,591
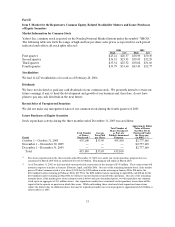
Consolidated Balance Sheets Data:
December 31,
(in thousands) 2001 2002 2003 2004 2005
Cash and cash equivalents $ 333,886 $ 234,073 $ 415,892 $ 823,723 $ 1,429,693
Marketable debt securities $ 1,138,107 $ 1,299,965 $ 2,150,323 $ 2,918,539 $ 2,570,155
Working capital $ 693,016 $ 558,190 $ 1,013,913 $ 2,909,768 $ 2,245,481
Total assets $ 2,379,346 $ 2,790,181 $ 5,931,654 $ 9,178,201 $ 10,831,834
Long-term liabilities $ 23,806 $ 84,540 $ 822,890 $ 851,782 $ 1,061,367
Total stockholders’ equity $ 1,967,017 $ 2,262,270 $ 4,363,490 $ 7,101,446 $ 8,566,415
(1) Our net income for 2004 included gains related to sales of an investment of $314 million, net of tax, or $0.23 per basic share or
$0.22 per diluted share. Our net income for 2005 included gains related to sales of an investment of $580 million, net of tax; a
gain related to the divestiture of Yahoo! China in connection with the Alibaba transaction of $205 million, net of tax; and a tax
benefit of $248 million related to a subsidiary restructuring transaction. In aggregate, these items had an impact of $1,033
million on net income, or $0.74 per basic share or $0.70 per diluted share.