Yahoo 2005 Annual Report Download - page 86
Download and view the complete annual report
Please find page 86 of the 2005 Yahoo annual report below. You can navigate through the pages in the report by either clicking on the pages listed below, or by using the keyword search tool below to find specific information within the annual report.-
 1
1 -
2
-
3
-
4
-
5
-
6
-
7
-
8
-
9
-
10
-
11
-
12
-
13
-
14
-
15
-
16
-
17
-
18
-
19
-
20
-
21
-
22
-
23
-
24
-
25
-
26
-
27
-
28
-
29
-
30
-
31
-
32
-
33
-
34
-
35
-
36
-
37
-
38
-
39
-
40
-
41
-
42
-
43
-
44
-
45
-
46
-
47
-
48
-
49
-
50
-
51
-
52
-
53
-
54
-
55
-
56
-
57
-
58
-
59
-
60
-
61
-
62
-
63
-
64
-
65
-
66
-
67
-
68
-
69
-
70
-
71
-
72
-
73
-
74
-
75
-
 76
76 -
 77
77 -
 78
78 -
 79
79 -
 80
80 -
 81
81 -
 82
82 -
 83
83 -
 84
84 -
 85
85 -
 86
86 -
 87
87 -
 88
88 -
 89
89 -
 90
90 -
 91
91 -
 92
92 -
 93
93 -
 94
94 -
 95
95 -
 96
96 -
97
-
98
-
99
-
100
-
101
-
102
-
103
-
104
-
105
-
106
-
107
-
108
-
109
-
110
-
111
-
112
-
113
-
114
-
115
-
116
-
117
-
118
 |
 |

80
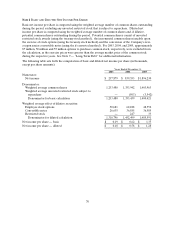
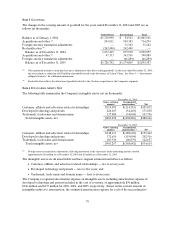
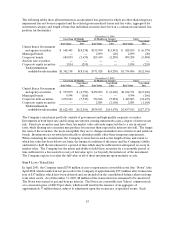
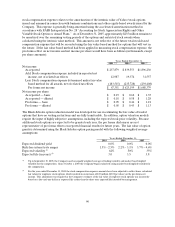
years is as follows: 2006: $214 million; 2007: $171 million; 2008: $116 million; 2009: $25 million and 2010:
$9 million.
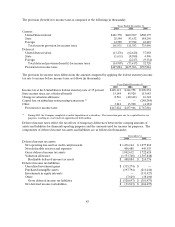
Note 7 CONSOLIDATED FINANCIAL STATEMENT DETAILS
Other income, net
Other income, net for 2003, 2004, and 2005 was as follows (in thousands):
Years Ended December 31,
2003 2004 2005
Interest and investment income $ 47,202 $ 60,830 $ 125,122
Investment gains (losses), net (1) (1,223) 415,125 967,327
Gain on divestiture of Yahoo! China (2) — — 337,965
Other 1,527 20,488 5,443
Total other income, net $ 47,506 $ 496,443 $ 1,435,857
(1) See Note 14 — “Litigation Settlement” for additional information related to the investment gains in the years ended
December 31, 2004 and 2005. Also included is an impairment loss of $28 million on an available-for-sale equity investment in
the year ended December 31, 2005.
(2) See Note 4 — “Investments in Equity Interests” for additional information related to the gain on the divestiture of Yahoo!
China for the year ended December 31, 2005.
Investment gains (losses), net include realized investment gains, realized investment losses, and
impairment charges related to declines in values of publicly traded securities and securities of privately
held companies judged to be other than temporary.
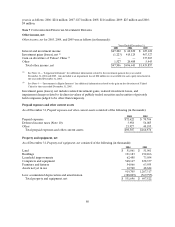
Prepaid expenses and other current assets
As of December 31, Prepaid expenses and other current assets consisted of the following (in thousands):
2004 2005
Prepaid expenses $ 72,622 $ 70,706
Deferred income taxes (Note 10) 3,958 56,085
Other 21,927 40,185
Total prepaid expenses and other current assets $ 98,507 $ 166,976
Property and equipment, net
As of December 31, Property and equipment, net consisted of the following (in thousands):
2004 2005
Land $ 51,061 $ 51,061
Buildings 191,183 192,266
Leasehold improvements 62,488 73,054
Computers and equipment 548,167 838,357
Furniture and fixtures 54,066 63,955
Assets not yet in use 12,740 48,624
919,705 1,267,317
Less: accumulated depreciation and amortization (388,009 ) (569,795)
Total property and equipment, net $ 531,696 $ 697,522