Yahoo 2005 Annual Report Download - page 48
Download and view the complete annual report
Please find page 48 of the 2005 Yahoo annual report below. You can navigate through the pages in the report by either clicking on the pages listed below, or by using the keyword search tool below to find specific information within the annual report.-
 1
1 -
2
-
3
-
4
-
5
-
6
-
7
-
8
-
9
-
10
-
11
-
12
-
13
-
14
-
15
-
16
-
17
-
18
-
19
-
20
-
21
-
22
-
23
-
24
-
25
-
26
-
27
-
28
-
29
-
30
-
31
-
32
-
33
-
34
-
35
-
36
-
37
-
 38
38 -
 39
39 -
 40
40 -
 41
41 -
 42
42 -
 43
43 -
 44
44 -
 45
45 -
 46
46 -
 47
47 -
 48
48 -
 49
49 -
 50
50 -
 51
51 -
 52
52 -
 53
53 -
 54
54 -
 55
55 -
 56
56 -
 57
57 -
 58
58 -
59
-
60
-
61
-
62
-
63
-
64
-
65
-
66
-
67
-
68
-
69
-
70
-
71
-
72
-
73
-
74
-
75
-
76
-
77
-
78
-
79
-
80
-
81
-
82
-
83
-
84
-
85
-
86
-
87
-
88
-
89
-
90
-
91
-
92
-
93
-
94
-
95
-
96
-
97
-
98
-
99
-
100
-
101
-
102
-
103
-
104
-
105
-
106
-
107
-
108
-
109
-
110
-
111
-
112
-
113
-
114
-
115
-
116
-
117
-
118
 |
 |
42
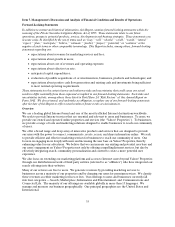
organization of listings within Yahoo! Properties and research and development, as well as depreciation
expense and other operating costs.
Product development expenses for the year ended December 31, 2005 increased approximately $178
million, or 48 percent, as compared to the prior year. Approximately $121 million related to increased
compensation expense as we continued to hire engineers to further develop and create new offerings and
services on the Yahoo! Properties. Additionally, approximately $22 million of the increase related to
higher depreciation expense arising from our additional investments in property and equipment to support
further product development, and $23 million related to the increase in supplies and equipment related
expenses required to support our growing headcount. Product development expenses for the year ended
December 31, 2004, increased approximately $161 million, or 78 percent, as compared to 2003. Product
development expenses increased by approximately $104 million due to incremental costs related to
acquisitions. The majority of the remainder of the increase was due to increases of $34 million of
compensation related expenses and $14 million of depreciation expense.
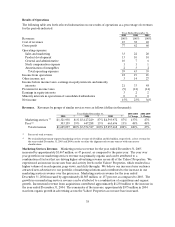
Product development expenses in 2005, 2004, and 2003 as a percentage of revenues were 10 percent,
10 percent, and 13 percent, respectively, and decreased as a result of the overall increase in revenues and
savings as a result of our overall effort to manage discretionary costs.
We currently believe that product development expenses will increase in absolute dollars in 2006 compared
to 2005, as we believe that continued investments in product development are required to remain
competitive.
General and Administrative. General and administrative expenses consist primarily of compensation
related expenses and fees for professional services.
General and administrative expenses for the year ended December 31, 2005 increased approximately
$57 million, or 22 percent, as compared to the prior year. The increase was primarily due to a $48 million
increase in outside services and compensation related expenses, which related to the expansion of our team
to support growing compliance and infrastructure needs. General and administrative expenses for the year
ended December 31, 2004 increased approximately $106 million, or 67 percent, as compared to 2003.
General and administrative expenses increased by approximately $66 million due to incremental costs
related to acquisitions. The remainder of the increase was primarily due to an increase of $24 million of
professional services expenses and $16 million in compensation related expenses. Similar to the increase in
2005, the year over year increase in 2004 in compensation related expense reflected expansion of our team
in line with, and to support, increased compliance and infrastructure needs.
General and administrative expenses as a percentage of revenues were 6 percent, 7 percent, and 10 percent
in 2005, 2004, and 2003, respectively. The decrease is a result of the overall increase in revenues and
savings as a result of our overall effort to manage discretionary costs.
We currently believe that general and administrative expenses in absolute dollars will increase in 2006
compared to 2005, as we continue to invest in our infrastructure to support our continued business
expansion.
Stock Compensation. Stock compensation expense relates to the amortization of the intrinsic value of
Yahoo! stock options issued and assumed in connection with business combinations and other
equity-based awards that we issued. This expense is generally being amortized using the accelerated
amortization method in accordance with Financial Accounting Standards Board (“FASB”) Interpretation
No. 28 “Accounting for Stock Appreciation Rights and Other Variable Stock Option or Award Plans.”
The increase in stock compensation expense for the year ended December 31, 2005, was primarily a result
of the amortization expense of newly issued equity-based awards partially offset by decreased costs
associated with options assumed in acquisitions. The amortization of options assumed in acquisitions has