Yahoo 2005 Annual Report Download - page 44
Download and view the complete annual report
Please find page 44 of the 2005 Yahoo annual report below. You can navigate through the pages in the report by either clicking on the pages listed below, or by using the keyword search tool below to find specific information within the annual report.-
 1
1 -
2
-
3
-
4
-
5
-
6
-
7
-
8
-
9
-
10
-
11
-
12
-
13
-
14
-
15
-
16
-
17
-
18
-
19
-
20
-
21
-
22
-
23
-
24
-
25
-
26
-
27
-
28
-
29
-
30
-
31
-
32
-
33
-
 34
34 -
 35
35 -
 36
36 -
 37
37 -
 38
38 -
 39
39 -
 40
40 -
 41
41 -
 42
42 -
 43
43 -
 44
44 -
 45
45 -
 46
46 -
 47
47 -
 48
48 -
 49
49 -
 50
50 -
 51
51 -
 52
52 -
 53
53 -
 54
54 -
55
-
56
-
57
-
58
-
59
-
60
-
61
-
62
-
63
-
64
-
65
-
66
-
67
-
68
-
69
-
70
-
71
-
72
-
73
-
74
-
75
-
76
-
77
-
78
-
79
-
80
-
81
-
82
-
83
-
84
-
85
-
86
-
87
-
88
-
89
-
90
-
91
-
92
-
93
-
94
-
95
-
96
-
97
-
98
-
99
-
100
-
101
-
102
-
103
-
104
-
105
-
106
-
107
-
108
-
109
-
110
-
111
-
112
-
113
-
114
-
115
-
116
-
117
-
118
 |
 |

38
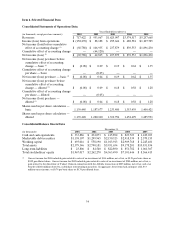
Results of Operations
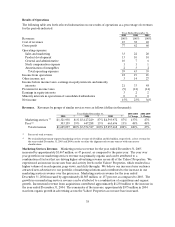
The following table sets forth selected information on our results of operations as a percentage of revenues
for the periods indicated:
Years Ended December 31,
2003 2004 2005
Revenues 100 % 100 % 100%
Cost of revenues 23 38 40
Gross profit 77 62 60
Operating expenses:
Sales and marketing 33 22 20
Product development 13 10 10
General and administrative 10 7 6
Stock compensation expense 1 1 1
Amortization of intangibles 2 3 2
Total operating expenses 59 43 39
Income from operations 18 19 21
Other income, net 3 14 27
Income before income taxes, earnings in equity interests, and minority
interests 21 33 48
Provision for income taxes (9 ) (12 ) (14)
Earnings in equity interests 3 2 2
Minority interests in operations of consolidated subsidiaries 0 0 0
Net income 15 % 23 % 36%
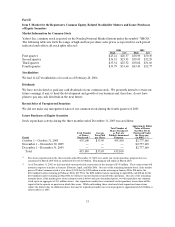
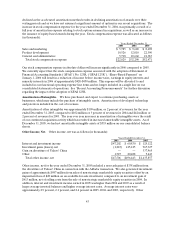
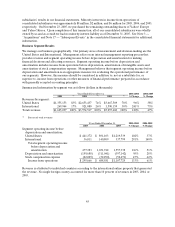
Revenues. Revenues by groups of similar services were as follows (dollars in thousands):
Years Ended December 31, 2003-2004 2004-2005
2003
(1) 2004 (1) 2005 (1) % Change % Change
Marketing services (2) $ 1,321,938 81% $ 3,127,229 87% $ 4,593,972 87 % 137 % 47%
Fees (2) 303,159 19% 447,288 13% 663,696 13 % 48 % 48%
Total revenues $ 1,625,097 100% $ 3,574,517 100% $ 5,257,668 100 % 120 % 47%
(1) Percent of total revenues.
(2) We reclassified previously reported marketing services revenue of $5 million and $22 million, respectively, as fees revenue for
the years ended December 31, 2003 and 2004 in order to refine the alignment of revenue sources with current year
classifications.
Marketing Services Revenue. Marketing services revenue for the year ended December 31, 2005
increased by approximately $1,467 million, or 47 percent, as compared to the prior year. The year over
year growth in our marketing services revenue was primarily organic and can be attributed to a
combination of factors that are driving higher advertising revenue across all of the Yahoo! Properties. We
experienced an increase in our user base and activity levels on the Yahoo! Properties, which resulted in a
higher volume of search queries, page views, and click-throughs. We believe our increased user audience
attracted new advertisers to our portfolio of marketing solutions and contributed to the increase in our
marketing services revenue over the prior year. Marketing services revenue for the year ended
December 31, 2004 increased by approximately $1,805 million, or 137 percent, as compared to 2003. The
growth in our marketing services revenue can be attributed to a combination of acquisitions and organic
growth. Incremental revenue from acquisitions contributed approximately $1,230 million to the increase in
the year ended December 31, 2004. The remainder of the increase, approximately $575 million in 2004
was from organic growth in advertising across the Yahoo! Properties as our user base increased.