Yahoo 2005 Annual Report Download - page 46
Download and view the complete annual report
Please find page 46 of the 2005 Yahoo annual report below. You can navigate through the pages in the report by either clicking on the pages listed below, or by using the keyword search tool below to find specific information within the annual report.-
 1
1 -
2
-
3
-
4
-
5
-
6
-
7
-
8
-
9
-
10
-
11
-
12
-
13
-
14
-
15
-
16
-
17
-
18
-
19
-
20
-
21
-
22
-
23
-
24
-
25
-
26
-
27
-
28
-
29
-
30
-
31
-
32
-
33
-
34
-
35
-
 36
36 -
 37
37 -
 38
38 -
 39
39 -
 40
40 -
 41
41 -
 42
42 -
 43
43 -
 44
44 -
 45
45 -
 46
46 -
 47
47 -
 48
48 -
 49
49 -
 50
50 -
 51
51 -
 52
52 -
 53
53 -
 54
54 -
 55
55 -
 56
56 -
57
-
58
-
59
-
60
-
61
-
62
-
63
-
64
-
65
-
66
-
67
-
68
-
69
-
70
-
71
-
72
-
73
-
74
-
75
-
76
-
77
-
78
-
79
-
80
-
81
-
82
-
83
-
84
-
85
-
86
-
87
-
88
-
89
-
90
-
91
-
92
-
93
-
94
-
95
-
96
-
97
-
98
-
99
-
100
-
101
-
102
-
103
-
104
-
105
-
106
-
107
-
108
-
109
-
110
-
111
-
112
-
113
-
114
-
115
-
116
-
117
-
118
 |
 |

40
approximately $4 in 2004 from $5 in 2003 due to faster subscriber growth in some of our lower priced
offerings, and the introduction of lower priced fee-based services.
We currently expect marketing services revenue to increase in absolute dollars for 2006 compared to 2005
as we seek to increase users and traffic on our Yahoo! Properties and further benefit from expected growth
in the online advertising market. We also currently expect fees revenue to increase in absolute dollars for
2006 compared to 2005 as we expect to increase our number of paying users in 2006.
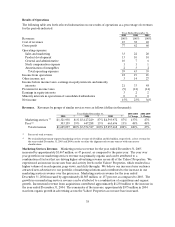
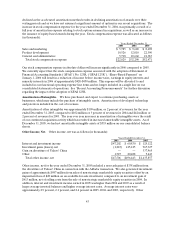
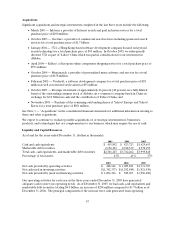
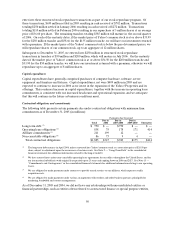
Costs and Expenses: Operating costs and expenses were as follows (dollars in thousands):
Years Ended December 31, 2003-2004 2004-2005
2003
(1) 2004 (1) 2005 (1) % Change % Change
Cost of revenues $ 370,092 23% $ 1,342,338 38% $ 2,096,201 40 % 263 % 56%
Sales and marketing $ 530,613 33% $ 778,029 22% $ 1,025,249 20 % 47 % 32%
Product development $ 207,285 13% $ 368,760 10% $ 547,137 10 % 78 % 48%
General and administrative $ 157,027 10% $ 262,602 7% $ 319,690 6 % 67 % 22%
Stock compensation expense $ 22,029 1% $ 32,290 1% $ 52,471 1 % 47 % 62%
Amortization of intangibles $ 42,385 2% $ 101,917 3% $ 109,195 2 % 140 % 7%
(1) Percent of total revenues.
Cost of Revenues. Cost of revenues consists of traffic acquisition costs and other expenses associated with
the production and usage of the Yahoo! Properties, including amortization of developed technology and
patents.
Traffic Acquisition Costs (“TAC”). TAC consists of payments made to affiliates that have integrated our
search offerings into their websites and payments made to companies that direct consumer and business
traffic to the Yahoo! Properties. We enter into agreements of varying duration that involve TAC. There
are generally three economic structures of the affiliate agreements: fixed payments based on a guaranteed
minimum amount of traffic delivered, which often carry reciprocal performance guarantees from the
affiliate; variable payments based on a percentage of our revenue or based on a certain metric, such as
number of searches or paid clicks; or a combination of the two. We expense TAC under two different
methods. Agreements with fixed payments are expensed ratably over the term the fixed payment covers,
and agreements based on a percentage of revenue, number of paid introductions, number of searches, or
other metrics are expensed based on the volume of the underlying activity or revenue multiplied by the
agreed-upon price or rate.
Other Cost of Revenues. Other cost of revenues consists of fees paid to third parties for content included
on our online media properties, Internet connection charges, data center costs, server equipment
depreciation, technology license fees, amortization of developed technology and patents, and
compensation related expenses.
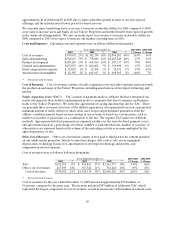
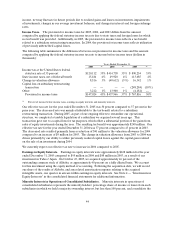
Cost of revenues were as follows (dollars in thousands):
Years Ended December 31, 2003-2004 2004-2005
2003
(1) 2004 (1) 2005 (1) % Change % Change
TAC $ 152,583 9% $ 974,814 27% $ 1,561,737 30% 539 % 60%
Other cost of revenues 217,509 14% 367,524 11% 534,464 10% 69 % 45%
Cost of revenues $ 370,092 23% $ 1,342,338 38% $ 2,096,201 40% 263 % 56%
(1) Percent of total revenues.
Cost of revenues for the year ended December 31, 2005 increased approximately $754 million, or
56 percent, compared to the prior year. The increase included $587 million of additional TAC, which
represents the largest component of cost of revenues, as well as an increase of $64 million in content costs,