Yahoo 2005 Annual Report Download - page 72
Download and view the complete annual report
Please find page 72 of the 2005 Yahoo annual report below. You can navigate through the pages in the report by either clicking on the pages listed below, or by using the keyword search tool below to find specific information within the annual report.-
 1
1 -
2
-
3
-
4
-
5
-
6
-
7
-
8
-
9
-
10
-
11
-
12
-
13
-
14
-
15
-
16
-
17
-
18
-
19
-
20
-
21
-
22
-
23
-
24
-
25
-
26
-
27
-
28
-
29
-
30
-
31
-
32
-
33
-
34
-
35
-
36
-
37
-
38
-
39
-
40
-
41
-
42
-
43
-
44
-
45
-
46
-
47
-
48
-
49
-
50
-
51
-
52
-
53
-
54
-
55
-
56
-
57
-
58
-
59
-
60
-
61
-
 62
62 -
 63
63 -
 64
64 -
 65
65 -
 66
66 -
 67
67 -
 68
68 -
 69
69 -
 70
70 -
 71
71 -
 72
72 -
 73
73 -
 74
74 -
 75
75 -
 76
76 -
 77
77 -
 78
78 -
 79
79 -
 80
80 -
 81
81 -
 82
82 -
83
-
84
-
85
-
86
-
87
-
88
-
89
-
90
-
91
-
92
-
93
-
94
-
95
-
96
-
97
-
98
-
99
-
100
-
101
-
102
-
103
-
104
-
105
-
106
-
107
-
108
-
109
-
110
-
111
-
112
-
113
-
114
-
115
-
116
-
117
-
118
 |
 |

66
often carry reciprocal performance guarantees from the affiliate; variable payments based on a percentage
of the Company’s revenue or based on a certain metric, such as number of searches or paid clicks; or a
combination of the two. The Company expenses, as cost of revenues, traffic acquisition costs associated
with affiliate arrangements under two different methods depending on the structure of the agreement.
Agreements with fixed payments are expensed ratably over the term the fixed payment covers.
Agreements based on a percentage of revenue, number of paid introductions, number of searches, or other
metrics are expensed based on the volume of the underlying activity or revenue multiplied by the agreed-
upon price or rate.
Internal Use Software and Website Development Costs. The Company has capitalized certain internal
use software and website development costs totaling approximately $11 million, $19 million, and
$18 million during 2003, 2004, and 2005, respectively. The estimated useful life of costs capitalized is
evaluated for each specific project and ranges from one to three years. During 2003, 2004, and 2005, the
amortization of capitalized costs totaled approximately $9 million, $11 million, and $18 million,
respectively. Capitalized internal use software and website development costs are included in property and
equipment, net.
Product Development. Product development expenses consist primarily of compensation related
expenses incurred for enhancements to and maintenance of the Yahoo! Properties, classification and
organization of listings within Yahoo! Properties, and research and development as well as depreciation
expense and other operating costs.
Advertising Costs. Advertising production costs are recorded as expense the first time an advertisement
appears. Costs of communicating advertising are recorded as expense as advertising space or airtime is
used. All other advertising costs are expensed as incurred. Advertising expense totaled approximately
$115 million, $160 million, and $201 million for 2003, 2004, and 2005, respectively.
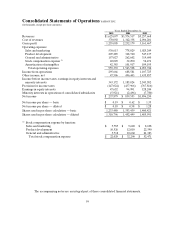
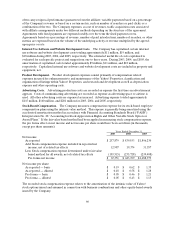
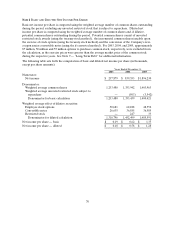
Stock-Based Compensation. The Company measures compensation expense for its stock-based employee
compensation plans using the intrinsic value method. This expense is generally being amortized using the
accelerated amortization method in accordance with Financial Accounting Standards Board (“FASB”)
Interpretation No. 28 “Accounting for Stock Appreciation Rights and Other Variable Stock Option or
Award Plans.” If the fair value based method had been applied in measuring stock compensation expense,
the pro forma effect on net income and net income per share would have been as follows (in thousands,
except per share amounts):
Years Ended December 31,
2003 2004 2005
Net income:
As reported $ 237,879 $ 839,553 $ 1,896,230
Add: Stock compensation expense included in reported net
income, net of related tax effects 12,987 19,374 31,557
Less: Stock compensation expense determined under fair value
based method for all awards, net of related tax effects (183,515) (235,728 ) (239,408)
Pro forma net income $ 67,351 $ 623,199 $ 1,688,379
Net income per share:
As reported — basic $ 0.19 $ 0.62 $ 1.35
As reported — diluted $ 0.18 $ 0.58 $ 1.28
Pro forma — basic $ 0.05 $ 0.46 $ 1.21
Pro forma — diluted $ 0.05 $ 0.43 $ 1.13
The recorded stock compensation expense relates to the amortization of the intrinsic value of Yahoo!
stock options issued and assumed in connection with business combinations and other equity-based awards
issued by the Company.