Yahoo 2005 Annual Report Download - page 67
Download and view the complete annual report
Please find page 67 of the 2005 Yahoo annual report below. You can navigate through the pages in the report by either clicking on the pages listed below, or by using the keyword search tool below to find specific information within the annual report.-
 1
1 -
2
-
3
-
4
-
5
-
6
-
7
-
8
-
9
-
10
-
11
-
12
-
13
-
14
-
15
-
16
-
17
-
18
-
19
-
20
-
21
-
22
-
23
-
24
-
25
-
26
-
27
-
28
-
29
-
30
-
31
-
32
-
33
-
34
-
35
-
36
-
37
-
38
-
39
-
40
-
41
-
42
-
43
-
44
-
45
-
46
-
47
-
48
-
49
-
50
-
51
-
52
-
53
-
54
-
55
-
56
-
 57
57 -
 58
58 -
 59
59 -
 60
60 -
 61
61 -
 62
62 -
 63
63 -
 64
64 -
 65
65 -
 66
66 -
 67
67 -
 68
68 -
 69
69 -
 70
70 -
 71
71 -
 72
72 -
 73
73 -
 74
74 -
 75
75 -
 76
76 -
 77
77 -
78
-
79
-
80
-
81
-
82
-
83
-
84
-
85
-
86
-
87
-
88
-
89
-
90
-
91
-
92
-
93
-
94
-
95
-
96
-
97
-
98
-
99
-
100
-
101
-
102
-
103
-
104
-
105
-
106
-
107
-
108
-
109
-
110
-
111
-
112
-
113
-
114
-
115
-
116
-
117
-
118
 |
 |

61
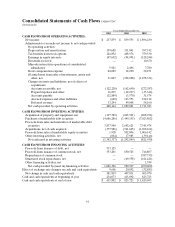
Consolidated Statements of Cash Flows YAHOO! INC.
(in thousands)
Years Ended December 31,
2003 2004 2005
CASH FLOWS FROM OPERATING ACTIVITIES:
Net income $ 237,879 $ 839,553 $ 1,896,230
Adjustments to reconcile net income to net cash provided
by operating activities:
Depreciation and amortization 159,688 311,041 397,142
Tax benefits from stock options 124,852 408,976 759,530
Earnings in equity interests (47,652) (94,991 ) (128,244)
Dividends received — — 10,670
Minority interests in operations of consolidated
subsidiaries 5,921 2,496 7,780
Stock compensation expense 22,029 32,290 52,471
(Gains)/losses from sales of investments, assets and
other, net 11,047 (394,028 ) (1,278,311)
Changes in assets and liabilities, net of effects of
acquisitions:
Accounts receivable, net (122,220) (162,690 ) (272,387)
Prepaid expenses and other 16,835 (12,217 ) (35,344)
Accounts payable (12,889) (3,570 ) 31,574
Accrued expenses and other liabilities (640) 113,953 212,112
Deferred revenue 33,294 49,008 58,160
Net cash provided by operating activities 428,144 1,089,821 1,711,383
CASH FLOWS FROM INVESTING ACTIVITIES:
Acquisition of property and equipment, net (117,329) (245,501 ) (408,934)
Purchases of marketable debt securities (4,686,286) (3,449,155 ) (7,023,802)
Proceeds from sales and maturities of marketable debt
securities 3,837,940 2,642,621 7,341,974
Acquisitions, net of cash acquired (377,986) (761,605 ) (1,698,164)
Proceeds from sales of marketable equity securities 1,928 502,806 1,006,142
Other investing activities, net (604) 17,985 (39,146)
Net cash used in investing activities (1,342,337) (1,292,849 ) (821,930)
CASH FLOWS FROM FINANCING ACTIVITIES:
Proceeds from issuance of debt, net 733,125 — —
Proceeds from issuance of common stock, net 353,201 650,525 746,807
Repurchases of common stock — — (387,735)
Structured stock repurchases, net — (69,558 ) (611,421)
Other financing activities, net — 1,749
Net cash provided by (used in) financing activities 1,086,326 580,967 (250,600)
Effect of exchange rate changes on cash and cash equivalents 9,686 29,892 (32,883)
Net change in cash and cash equivalents 181,819 407,831 605,970
Cash and cash equivalents at beginning of year 234,073 415,892 823,723
Cash and cash equivalents at end of year $ 415,892 $ 823,723 $ 1,429,693