Yahoo 2005 Annual Report Download - page 76
Download and view the complete annual report
Please find page 76 of the 2005 Yahoo annual report below. You can navigate through the pages in the report by either clicking on the pages listed below, or by using the keyword search tool below to find specific information within the annual report.-
 1
1 -
2
-
3
-
4
-
5
-
6
-
7
-
8
-
9
-
10
-
11
-
12
-
13
-
14
-
15
-
16
-
17
-
18
-
19
-
20
-
21
-
22
-
23
-
24
-
25
-
26
-
27
-
28
-
29
-
30
-
31
-
32
-
33
-
34
-
35
-
36
-
37
-
38
-
39
-
40
-
41
-
42
-
43
-
44
-
45
-
46
-
47
-
48
-
49
-
50
-
51
-
52
-
53
-
54
-
55
-
56
-
57
-
58
-
59
-
60
-
61
-
62
-
63
-
64
-
65
-
 66
66 -
 67
67 -
 68
68 -
 69
69 -
 70
70 -
 71
71 -
 72
72 -
 73
73 -
 74
74 -
 75
75 -
 76
76 -
 77
77 -
 78
78 -
 79
79 -
 80
80 -
 81
81 -
 82
82 -
 83
83 -
 84
84 -
 85
85 -
 86
86 -
87
-
88
-
89
-
90
-
91
-
92
-
93
-
94
-
95
-
96
-
97
-
98
-
99
-
100
-
101
-
102
-
103
-
104
-
105
-
106
-
107
-
108
-
109
-
110
-
111
-
112
-
113
-
114
-
115
-
116
-
117
-
118
 |
 |

70
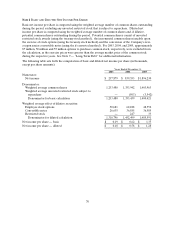
Note 2 BASIC AND DILUTED NET INCOME PER SHARE
Basic net income per share is computed using the weighted average number of common shares outstanding
during the period, excluding any unvested restricted stock that is subject to repurchase. Diluted net
income per share is computed using the weighted average number of common shares and, if dilutive,
potential common shares outstanding during the period. Potential common shares consist of unvested
restricted stock awards (using the treasury stock method), the incremental common shares issuable upon
the exercise of stock options (using the treasury stock method) and the conversion of the Company’s zero
coupon senior convertible notes (using the if-converted method). For 2003, 2004, and 2005, approximately
87 million, 50 million and 55 million options to purchase common stock, respectively, were excluded from
the calculation, as the exercise prices were greater than the average market price of the common stock
during the respective years. See Note 9 — “Long-Term Debt” for additional information.
The following table sets forth the computation of basic and diluted net income per share (in thousands,
except per share amounts):
Years Ended December 31,
2003 2004 2005
Numerator:
Net income $ 237,879 $ 839,553 $ 1,896,230
Denominator:
Weighted average common shares 1,233,480 1,353,942 1,403,963
Weighted average unvested restricted stock subject to
repurchase — (503 ) (3,542)
Denominator for basic calculation 1,233,480 1,353,439 1,400,421
Weighted average effect of dilutive securities:
Employee stock options 50,681 62,228 48,552
Convertible notes 26,635 36,585 36,585
Restricted stock — 247 33
Denominator for diluted calculation 1,310,796 1,452,499 1,485,591
Net income per share — basic $ 0.19 $ 0.62 $ 1.35
Net income per share — diluted $ 0.18 $ 0.58 $ 1.28