Yahoo 2005 Annual Report Download - page 45
Download and view the complete annual report
Please find page 45 of the 2005 Yahoo annual report below. You can navigate through the pages in the report by either clicking on the pages listed below, or by using the keyword search tool below to find specific information within the annual report.-
 1
1 -
2
-
3
-
4
-
5
-
6
-
7
-
8
-
9
-
10
-
11
-
12
-
13
-
14
-
15
-
16
-
17
-
18
-
19
-
20
-
21
-
22
-
23
-
24
-
25
-
26
-
27
-
28
-
29
-
30
-
31
-
32
-
33
-
34
-
 35
35 -
 36
36 -
 37
37 -
 38
38 -
 39
39 -
 40
40 -
 41
41 -
 42
42 -
 43
43 -
 44
44 -
 45
45 -
 46
46 -
 47
47 -
 48
48 -
 49
49 -
 50
50 -
 51
51 -
 52
52 -
 53
53 -
 54
54 -
 55
55 -
56
-
57
-
58
-
59
-
60
-
61
-
62
-
63
-
64
-
65
-
66
-
67
-
68
-
69
-
70
-
71
-
72
-
73
-
74
-
75
-
76
-
77
-
78
-
79
-
80
-
81
-
82
-
83
-
84
-
85
-
86
-
87
-
88
-
89
-
90
-
91
-
92
-
93
-
94
-
95
-
96
-
97
-
98
-
99
-
100
-
101
-
102
-
103
-
104
-
105
-
106
-
107
-
108
-
109
-
110
-
111
-
112
-
113
-
114
-
115
-
116
-
117
-
118
 |
 |
39
On the Yahoo! Properties, our estimated number of unique users worldwide as of December 31, 2005 was
approximately 6 percent higher than the number of unique users as of December 31, 2004, which was
31 percent higher than December 31, 2003. Unique users are the estimated number of people who visited
the Yahoo! Properties in a given time period. The unique user estimate as of December 31, 2005 does not
include the unique users of Yahoo! China as it was divested in October 2005 in connection with our
strategic investment in Alibaba. If the unique users of Yahoo! China had been excluded as of
December 31, 2004, our estimated unique users as of December 31, 2005 would have been 21 percent
higher than as of December 31, 2004.
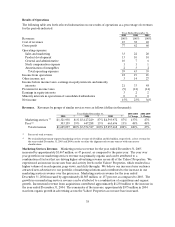
The combined number of page views and searches, including those from our affiliate network, increased by
approximately 40 percent in 2005 as compared to the prior year. This growth was primarily organic. The
combined number of page views and searches in 2004, including those from our affiliate network increased
by approximately 50 percent as compared to 2003, with approximately 10 percent of the increase in volume
attributable to acquisitions. The increases in the organic volume of page views and searches can be
attributed to an increased number of users, an increased number of affiliates, an expanded offering of
properties which increased our inventory of page views, and greater market acceptance of our search
offerings. The combined average revenue per page view and search increased by approximately 5 percent
in 2005 compared to 2004. This growth was primarily organic. The combined average revenue per
page view and search increased by approximately 55 percent in 2004 compared to 2003, of which
approximately one-half was attributable to acquisitions. Our combined revenue per page view and search
was impacted by sales mix changes from period to period as we expanded our offerings on the Yahoo!
Properties and introduced new inventory with differing yields.
We believe our growing number of users, advertisers and inventory has been driving this growth in our
marketing services revenues. We believe our expanding offerings as well as our enhanced algorithmic
search technology, which provides a new level of personalization to the search experience, contribute to
our growing number of users. As our user base increases, we generate a higher number of page views,
which we view as inventory, and process a higher number of search queries which potentially result in a
higher number of impressions and paid clicks. We also believe that our growing user base makes the
Yahoo! Properties more attractive to advertisers and increases their spending on marketing solutions.
Further, we believe the growth in users on the Yahoo! Properties and on the Internet overall reflects the
increasing acceptance, importance and dependence of users on the Internet. As a result of the increasing
online audience, we believe advertisers are shifting a greater percentage of their spending from traditional
media to the Internet to reach this growing audience.
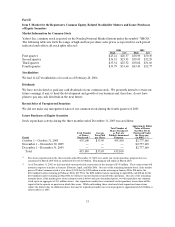
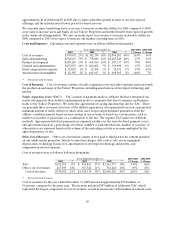
Fees Revenue. For the year ended December 31, 2005, fees revenue increased approximately
$216 million, or 48 percent, as compared to the prior year. Approximately $46 million of the increase was
attributable to acquisitions and $147 million of the increase was associated with an increase in the number
of paying users for our fee-based services, which numbered 12.6 million as of December 31, 2005 compared
to 8.4 million as of December 31, 2004. Our increased base of paying users was due to growth in users
across most of our offerings, with the largest growth generated from new Internet broadband users in the
year. Our fee-based services include Internet broadband services, sports, music, personals, and premium
mail offerings, as well as our services for small businesses. Average monthly revenue per paying user has
remained consistent at approximately $4 in 2005 and 2004.
For the year ended December 31, 2004, fees revenue increased approximately $144 million, or 48 percent,
as compared to 2003 of which $10 million related to acquisitions. Approximately $115 million was
associated with an increase in the number of paying users for our fee-based services, which were 8.4 million
as of December 31, 2004 compared to 4.9 million as of December 31, 2003. Our increasing base of paying
users was due to a greater penetration of our services with our existing users as well as our continued
expansion of service offerings that took place during the year, including new business relationships with BT
and Rogers for fee-based services. Average monthly revenue per paying user per month declined to