APC 2015 Annual Report Download - page 10
Download and view the complete annual report
Please find page 10 of the 2015 APC annual report below. You can navigate through the pages in the report by either clicking on the pages listed below, or by using the keyword search tool below to find specific information within the annual report.-
 1
1 -
 2
2 -
 3
3 -
 4
4 -
 5
5 -
 6
6 -
 7
7 -
 8
8 -
 9
9 -
 10
10 -
 11
11 -
 12
12 -
 13
13 -
 14
14 -
 15
15 -
 16
16 -
 17
17 -
 18
18 -
 19
19 -
 20
20 -
 21
21 -
22
-
23
-
24
-
25
-
26
-
27
-
28
-
29
-
30
-
31
-
32
-
33
-
34
-
35
-
36
-
37
-
38
-
39
-
40
-
41
-
42
-
43
-
44
-
45
-
46
-
47
-
48
-
49
-
50
-
51
-
52
-
53
-
54
-
55
-
56
-
57
-
58
-
59
-
60
-
61
-
62
-
63
-
64
-
65
-
66
-
67
-
68
-
69
-
70
-
71
-
72
-
73
-
74
-
75
-
76
-
77
-
78
-
79
-
80
-
81
-
82
-
83
-
84
-
85
-
86
-
87
-
88
-
89
-
90
-
91
-
92
-
93
-
94
-
95
-
96
-
97
-
98
-
99
-
100
-
101
-
102
-
103
-
104
-
105
-
106
-
107
-
108
-
109
-
110
-
111
-
112
-
113
-
114
-
115
-
116
-
117
-
118
-
119
-
120
-
121
-
122
-
123
-
124
-
125
-
126
-
127
-
128
-
129
-
130
-
131
-
132
-
133
-
134
-
135
-
136
-
137
-
138
-
139
-
140
-
141
-
142
-
143
-
144
-
145
-
146
-
147
-
148
-
149
-
150
-
151
-
152
-
153
-
154
-
155
-
156
-
157
-
158
-
159
-
160
-
161
-
162
-
163
-
164
-
165
-
166
-
167
-
168
-
169
-
170
-
171
-
172
-
173
-
174
-
175
-
176
-
177
-
178
-
179
-
180
-
181
-
182
-
183
-
184
-
185
-
186
-
187
-
188
-
189
-
190
-
191
-
192
-
193
-
194
-
195
-
196
-
197
-
198
-
199
-
200
-
201
-
202
-
203
-
204
-
205
-
206
-
207
-
208
-
209
-
210
-
211
-
212
-
213
-
214
-
215
-
216
-
217
-
218
-
219
-
220
-
221
-
222
-
223
-
224
-
225
-
226
-
227
-
228
-
229
-
230
-
231
-
232
-
233
-
234
-
235
-
236
-
237
-
238
-
239
-
240
-
241
-
242
-
243
-
244
-
245
-
246
-
247
-
248
-
249
-
250
-
251
-
252
-
253
-
254
-
255
-
256
-
257
-
258
-
259
-
260
-
261
-
262
-
263
-
264
-
265
-
266
-
267
-
268
-
269
-
270
-
271
-
272
-
273
-
274
-
275
-
276
-
277
-
278
-
279
-
280
-
281
-
282
-
283
-
284
-
285
-
286
-
287
-
288
-
289
-
290
-
291
-
292
-
293
-
294
-
295
-
296
-
297
-
298
-
299
-
300
-
301
-
302
-
303
-
304
-
305
-
306
-
307
-
308
-
309
-
310
-
311
-
312
-
313
-
314
-
315
-
316
-
317
-
318
-
319
-
320
-
321
-
322
-
323
-
324
-
325
-
326
-
327
-
328
-
329
-
330
-
331
-
332
 |
 |

2015 REGISTRATION DOCUMENT SCHNEIDER ELECTRIC8
KEY FIGURES 2015
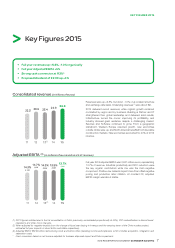
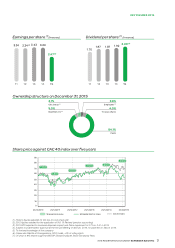
1,506
2,082
12(4) 13(5)
11 14 15
1,704
2,160 2,045 Free cash fl ow was 2.045 million euros, up +20% due to better
working capital management. Capital expenditure to revenues
ratio declined from 3.3% in 2014 to ~3% in 2015. Working capital
decreased due to strong control over payables and receivables.
Cash conversion remained high at 113%(6 ).
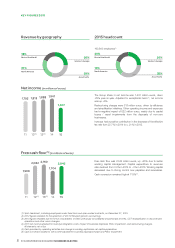
Revenue by geography
18%
Rest of the World
27%
North America
26%
Western Europe
29%
Asia-Pacific
(1) Spot headcount, including employees under fi xed-term and open-ended contracts, on December 31, 2015.
(2 ) 2012 fi gures restated for the applic tion of IAS 19 Revised (pension accounting).
(3 ) 2013 fi gures restated due to the full consolidation of Delixi (previously consolidated proportionally at 50%), CST reclassifi cation in discontinued
operations and other minor changes.
(4 ) 2015 net income adjusted for Invensys integration costs, impact of business disposals, Pelco impairment, and restructuring charges.
All elements net of tax.
(5 ) Cash provided by operating activities less change in working capital less net capital expenditure.
(6 ) Cash conversion based on net income adjusted for business disposals impact and Pelco impairment .
Net income (in millions of euros)
12(2)
1,793
13(3)
1,813
11 14 15
1,941
1,407
1,888 The Group share in net income was 1,407 million euros, down
-28% year-on-year. Adjusted for exceptional items (4 ), net income
was up +6%.
Restructuring charges were 318 million euros, driven by effi ciency
and simplifi cation initiatives. Other operating income and expenses
had a negative impact of 522 million euros, mainly due to capital
losses / asset impairments from the disposals of non-core
businesses.
Invensys had a positive contribution in the decrease of the effective
tax rate from 22.7% in 2014 to c. 21% in 2015.
Free cash flow(5 ) (in millions of euros)
2015 headcount
160,843 employees(1)
20%
Rest of the World
19%
North America
26%
Western Europe
35%
Asia-Pacific