APC 2015 Annual Report Download - page 183
Download and view the complete annual report
Please find page 183 of the 2015 APC annual report below. You can navigate through the pages in the report by either clicking on the pages listed below, or by using the keyword search tool below to find specific information within the annual report.-
 1
1 -
2
-
3
-
4
-
5
-
6
-
7
-
8
-
9
-
10
-
11
-
12
-
13
-
14
-
15
-
16
-
17
-
18
-
19
-
20
-
21
-
22
-
23
-
24
-
25
-
26
-
27
-
28
-
29
-
30
-
31
-
32
-
33
-
34
-
35
-
36
-
37
-
38
-
39
-
40
-
41
-
42
-
43
-
44
-
45
-
46
-
47
-
48
-
49
-
50
-
51
-
52
-
53
-
54
-
55
-
56
-
57
-
58
-
59
-
60
-
61
-
62
-
63
-
64
-
65
-
66
-
67
-
68
-
69
-
70
-
71
-
72
-
73
-
74
-
75
-
76
-
77
-
78
-
79
-
80
-
81
-
82
-
83
-
84
-
85
-
86
-
87
-
88
-
89
-
90
-
91
-
92
-
93
-
94
-
95
-
96
-
97
-
98
-
99
-
100
-
101
-
102
-
103
-
104
-
105
-
106
-
107
-
108
-
109
-
110
-
111
-
112
-
113
-
114
-
115
-
116
-
117
-
118
-
119
-
120
-
121
-
122
-
123
-
124
-
125
-
126
-
127
-
128
-
129
-
130
-
131
-
132
-
133
-
134
-
135
-
136
-
137
-
138
-
139
-
140
-
141
-
142
-
143
-
144
-
145
-
146
-
147
-
148
-
149
-
150
-
151
-
152
-
153
-
154
-
155
-
156
-
157
-
158
-
159
-
160
-
161
-
162
-
163
-
164
-
165
-
166
-
167
-
168
-
169
-
170
-
171
-
172
-
 173
173 -
 174
174 -
 175
175 -
 176
176 -
 177
177 -
 178
178 -
 179
179 -
 180
180 -
 181
181 -
 182
182 -
 183
183 -
 184
184 -
 185
185 -
 186
186 -
 187
187 -
 188
188 -
 189
189 -
 190
190 -
 191
191 -
 192
192 -
 193
193 -
194
-
195
-
196
-
197
-
198
-
199
-
200
-
201
-
202
-
203
-
204
-
205
-
206
-
207
-
208
-
209
-
210
-
211
-
212
-
213
-
214
-
215
-
216
-
217
-
218
-
219
-
220
-
221
-
222
-
223
-
224
-
225
-
226
-
227
-
228
-
229
-
230
-
231
-
232
-
233
-
234
-
235
-
236
-
237
-
238
-
239
-
240
-
241
-
242
-
243
-
244
-
245
-
246
-
247
-
248
-
249
-
250
-
251
-
252
-
253
-
254
-
255
-
256
-
257
-
258
-
259
-
260
-
261
-
262
-
263
-
264
-
265
-
266
-
267
-
268
-
269
-
270
-
271
-
272
-
273
-
274
-
275
-
276
-
277
-
278
-
279
-
280
-
281
-
282
-
283
-
284
-
285
-
286
-
287
-
288
-
289
-
290
-
291
-
292
-
293
-
294
-
295
-
296
-
297
-
298
-
299
-
300
-
301
-
302
-
303
-
304
-
305
-
306
-
307
-
308
-
309
-
310
-
311
-
312
-
313
-
314
-
315
-
316
-
317
-
318
-
319
-
320
-
321
-
322
-
323
-
324
-
325
-
326
-
327
-
328
-
329
-
330
-
331
-
332
 |
 |

2015 REGISTRATION DOCUMENT SCHNEIDER ELECTRIC 181
BUSINESS REVIEW
4
REVIEW OF THE CONSOLIDATED FINANCIAL STATEMENTS
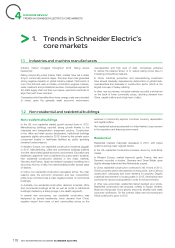
Italy driven by successful OEM offer launches in a favourable OEM
export market offset declines in Switzerland and the Nordics. North
America declined on weakness in industrial investments, notably in
Oil & Gas and lower export-oriented OEM demand due to a strong
dollar, and the focus remained on the improvement of the business
performance. Asia Pacifi c was penalized by weakness in China.
Rest of the world performed well.
The Infrastructure business generated revenues of EUR5,428million,
or 20% of the consolidated total. This represents an increase of
+2.9% on a reported basis and an increase of +0.3% on a like-for-
like basis. Western Europe grew, driven by growth in Spain, Italy and
the UK. Germany was down due to greater project selectivity. North
America was up thanks to project execution in Canada, while the US
was penalized by lower investment in Oil & Gas and delays in data
center investments, which more than offset the growth from targeted
initiatives . Asia-Pacifi c posted mixed trends with diffi culties in China,
weak utility market in Australia and growth in East Asia and India. The
Rest of the World was up driven by project execution in the Middle
East, while Russia was weak. Services were strong, up high single-
digit.
The IT business generated revenues of EUR3,657 million, or
14% of the consolidated total. This represents an increase of
+8.9% on a reported basis and a decrease of -0.9% on a like-
for-like basis. The US was about fl at, thanks to project execution
in a soft market. Western Europe was up, driven by successful
execution of commercial initiatives in a positive IT market . Asia
Pacifi c was dragged down by weakness in China and a high-base
of comparison in India. Rest of the World was down as weakness
in Russia more than offset the growth in the Middle East and Africa.
Services posted good growth.
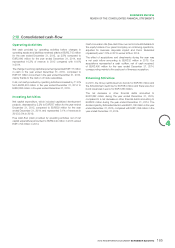
2.3 Gross profit
Gross profi t increased from EUR9,407million for the year ended
December 31, 2014 to EUR9,845 million for the year ended
December 31, 2015, or +4.7%, mainly due to an increase in
productivity and actions on prices and a positive foreign exchange
translation effect. As a percentage of revenues, the gross margin
decreased to 37.0% in 2015 (versus 37.7% in 2014), as the positive
net pricing and productivity impacts partially offset the negative mix
effect, increased R&D depreciation and cost infl ation.
2.4 Support Function Costs: research and development and selling, general
andadministrative expenses
Research and development expenses, excluding capitalized
development costs and development costs reported as cost
of sales, decreased by 0.4% from EUR567 million for the year
ended December31, 2014 to EUR565million for the year ended
December 31, 2015. As a percentage of revenues, the net cost
of research and development decreased to 2.1% of revenues for
the year ended December 31, 2015 (2.3% for the year ended
December31, 2014).
Total research and development expenses, including capitalized
development costs and development costs reported as cost of sales
(see note4 to the Consolidated Financial Statements) increased by
5.0% from EUR1,212million for the year ended December31, 2014
to EUR1,272million for the year ended December31, 2015. As a
percentage of revenues, total research and development expenses
remained stable at 4.8% for the year ended December31, 2015
from 4.9% for the year ended December31, 2014.
In 2015, the net effect of capitalized development costs and
amortization of capitalized development costs amounts to
EUR145 million on operating income versus EUR175 million in
2014.
Selling, general and administrative expenses increased by 4.9%
from EUR5,377 million for the year ended December 31, 2014
to EUR5,639million for the year ended December 31, 2015. As
a percentage of revenues, selling, general and administrative
expenses decreased from 21.6% in 2014 to 21.2% in 2015
Combined total support function costs, that is, research and
development expenses together with selling, general and
administrative costs, totalled EUR6,204million for the year ended
December 31, 2015 compared to EUR5,944 million for the year
ended December 31, 2014, an increase of 4.4%. The support
functions costs to sales ratio decreased from 23.8% for the
year ended December 31, 2014 to 23.3% for the year ended
December31, 2015 refl ecting progress in simplifi cation initiatives.