APC 2015 Annual Report Download - page 51
Download and view the complete annual report
Please find page 51 of the 2015 APC annual report below. You can navigate through the pages in the report by either clicking on the pages listed below, or by using the keyword search tool below to find specific information within the annual report.-
 1
1 -
2
-
3
-
4
-
5
-
6
-
7
-
8
-
9
-
10
-
11
-
12
-
13
-
14
-
15
-
16
-
17
-
18
-
19
-
20
-
21
-
22
-
23
-
24
-
25
-
26
-
27
-
28
-
29
-
30
-
31
-
32
-
33
-
34
-
35
-
36
-
37
-
38
-
39
-
40
-
 41
41 -
 42
42 -
 43
43 -
 44
44 -
 45
45 -
 46
46 -
 47
47 -
 48
48 -
 49
49 -
 50
50 -
 51
51 -
 52
52 -
 53
53 -
 54
54 -
 55
55 -
 56
56 -
 57
57 -
 58
58 -
 59
59 -
 60
60 -
 61
61 -
62
-
63
-
64
-
65
-
66
-
67
-
68
-
69
-
70
-
71
-
72
-
73
-
74
-
75
-
76
-
77
-
78
-
79
-
80
-
81
-
82
-
83
-
84
-
85
-
86
-
87
-
88
-
89
-
90
-
91
-
92
-
93
-
94
-
95
-
96
-
97
-
98
-
99
-
100
-
101
-
102
-
103
-
104
-
105
-
106
-
107
-
108
-
109
-
110
-
111
-
112
-
113
-
114
-
115
-
116
-
117
-
118
-
119
-
120
-
121
-
122
-
123
-
124
-
125
-
126
-
127
-
128
-
129
-
130
-
131
-
132
-
133
-
134
-
135
-
136
-
137
-
138
-
139
-
140
-
141
-
142
-
143
-
144
-
145
-
146
-
147
-
148
-
149
-
150
-
151
-
152
-
153
-
154
-
155
-
156
-
157
-
158
-
159
-
160
-
161
-
162
-
163
-
164
-
165
-
166
-
167
-
168
-
169
-
170
-
171
-
172
-
173
-
174
-
175
-
176
-
177
-
178
-
179
-
180
-
181
-
182
-
183
-
184
-
185
-
186
-
187
-
188
-
189
-
190
-
191
-
192
-
193
-
194
-
195
-
196
-
197
-
198
-
199
-
200
-
201
-
202
-
203
-
204
-
205
-
206
-
207
-
208
-
209
-
210
-
211
-
212
-
213
-
214
-
215
-
216
-
217
-
218
-
219
-
220
-
221
-
222
-
223
-
224
-
225
-
226
-
227
-
228
-
229
-
230
-
231
-
232
-
233
-
234
-
235
-
236
-
237
-
238
-
239
-
240
-
241
-
242
-
243
-
244
-
245
-
246
-
247
-
248
-
249
-
250
-
251
-
252
-
253
-
254
-
255
-
256
-
257
-
258
-
259
-
260
-
261
-
262
-
263
-
264
-
265
-
266
-
267
-
268
-
269
-
270
-
271
-
272
-
273
-
274
-
275
-
276
-
277
-
278
-
279
-
280
-
281
-
282
-
283
-
284
-
285
-
286
-
287
-
288
-
289
-
290
-
291
-
292
-
293
-
294
-
295
-
296
-
297
-
298
-
299
-
300
-
301
-
302
-
303
-
304
-
305
-
306
-
307
-
308
-
309
-
310
-
311
-
312
-
313
-
314
-
315
-
316
-
317
-
318
-
319
-
320
-
321
-
322
-
323
-
324
-
325
-
326
-
327
-
328
-
329
-
330
-
331
-
332
 |
 |

2015 REGISTRATION DOCUMENT SCHNEIDER ELECTRIC 49
SUSTAINABLE DEVELOPMENT
2
SUSTAINABLE DEVELOPMENT ATTHEHEART OFOURSTRATEGY
version of the Planet & Society barometer to the Sustainability
Executive Committee for approval before the launch of the Company
program. This Committee includes three members of the Executive
Committee: Strategy, Human Resources and Global Supply Chain.
Four cases may be included from one barometer to the next:
•the progress plans are maintained in the barometer and their
targets are renewed or increased;
•the progress plans change, new and more innovative or better
adapted indicators that cover the same subject are implemented;
the old indicators continue to be monitored internally if necessary;
•the progress plans are removed from the barometer ; this is also
the case with indicators that have reached a threshold; they
continue to be monitored internally if necessary;
•progress plans that respond to new issues are implemented.
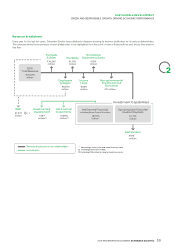
Operation and monitoring of
thePlanet&Society barometer
The Planet&Society barometer 2015-2017 is part of the Schneider
is On company program. It comprises 16 key performance
indicators scored out of 10. The average of the scores, with each
indicator weighted equally, provides the overall performance of the
barometer . Departments directly affected by the progress plans
(Human Resources, Environment, Access to Energy, etc.), each
represented by a project leader, implement measures to achieve
the objectives of the plans. This project leader works directly with
local managers in their respective areas.
The quarterly results of the barometer are supervised by the
Sustainability Executive Committee, which makes decisions on any
corrective actions that may be necessary to achieve the objectives.
This Committee meets two to three times a year.
See also the Planet & Society barometer criteria in variable
compensation page90 .
The table above shows Schneider Electric’s sustainable
development performance in 2015. When the barometer was
launched on January 1, 2015 the overall score was 3.00/10. At
the end of 2015, the Company exceeded its target of 4.5/10 and
attained 6.33/10.
Communicating the results of
thePlanet&Society barometer
The Planet&Society barometer is published through the following
channels:
•the quarterly non-fi nancial press releases and the quarterly
fi nancial and non-fi nancial Group results;
•Schneider Electric website and intranet;
•the « Webradios», which inform the sustainability fellows (see
page51 ) on sustainability performance and achievements for the
quarter and an update on key sustainability topics.
The non-fi nancial annual results are presented together with
the Group’s fi nancial results by Jean-Pascal Tricoire, in order to
demonstrate the Group’s commitment to making sustainable
development part of the Company’s long-term strategy. In addition,
from 2014, the quarterly barometer results are presented together
with the quarterly fi nancial information by Emmanuel Babeau to
institutional investors.
The publication of objectives and quarterly results is a way
for Schneider Electric to engage with its internal and external
stakeholders with regard to the objectives, to publicly disclose
its sustainable development challenges through the choice of
indicators, and to share progress made or diffi culties encountered
in a transparent manner.
The Planet&Society barometer is a tool that enables the Group
to anticipate and effectively manage its sustainability risks by
mobilizing key stakeholders around specifi c, measured objectives
and reliable results. The barometer ’s indicators are audited annually
by an external auditor (limited or reasonable assurance).