APC 2015 Annual Report Download - page 219
Download and view the complete annual report
Please find page 219 of the 2015 APC annual report below. You can navigate through the pages in the report by either clicking on the pages listed below, or by using the keyword search tool below to find specific information within the annual report.-
 1
1 -
2
-
3
-
4
-
5
-
6
-
7
-
8
-
9
-
10
-
11
-
12
-
13
-
14
-
15
-
16
-
17
-
18
-
19
-
20
-
21
-
22
-
23
-
24
-
25
-
26
-
27
-
28
-
29
-
30
-
31
-
32
-
33
-
34
-
35
-
36
-
37
-
38
-
39
-
40
-
41
-
42
-
43
-
44
-
45
-
46
-
47
-
48
-
49
-
50
-
51
-
52
-
53
-
54
-
55
-
56
-
57
-
58
-
59
-
60
-
61
-
62
-
63
-
64
-
65
-
66
-
67
-
68
-
69
-
70
-
71
-
72
-
73
-
74
-
75
-
76
-
77
-
78
-
79
-
80
-
81
-
82
-
83
-
84
-
85
-
86
-
87
-
88
-
89
-
90
-
91
-
92
-
93
-
94
-
95
-
96
-
97
-
98
-
99
-
100
-
101
-
102
-
103
-
104
-
105
-
106
-
107
-
108
-
109
-
110
-
111
-
112
-
113
-
114
-
115
-
116
-
117
-
118
-
119
-
120
-
121
-
122
-
123
-
124
-
125
-
126
-
127
-
128
-
129
-
130
-
131
-
132
-
133
-
134
-
135
-
136
-
137
-
138
-
139
-
140
-
141
-
142
-
143
-
144
-
145
-
146
-
147
-
148
-
149
-
150
-
151
-
152
-
153
-
154
-
155
-
156
-
157
-
158
-
159
-
160
-
161
-
162
-
163
-
164
-
165
-
166
-
167
-
168
-
169
-
170
-
171
-
172
-
173
-
174
-
175
-
176
-
177
-
178
-
179
-
180
-
181
-
182
-
183
-
184
-
185
-
186
-
187
-
188
-
189
-
190
-
191
-
192
-
193
-
194
-
195
-
196
-
197
-
198
-
199
-
200
-
201
-
202
-
203
-
204
-
205
-
206
-
207
-
208
-
 209
209 -
 210
210 -
 211
211 -
 212
212 -
 213
213 -
 214
214 -
 215
215 -
 216
216 -
 217
217 -
 218
218 -
 219
219 -
 220
220 -
 221
221 -
 222
222 -
 223
223 -
 224
224 -
 225
225 -
 226
226 -
 227
227 -
 228
228 -
 229
229 -
230
-
231
-
232
-
233
-
234
-
235
-
236
-
237
-
238
-
239
-
240
-
241
-
242
-
243
-
244
-
245
-
246
-
247
-
248
-
249
-
250
-
251
-
252
-
253
-
254
-
255
-
256
-
257
-
258
-
259
-
260
-
261
-
262
-
263
-
264
-
265
-
266
-
267
-
268
-
269
-
270
-
271
-
272
-
273
-
274
-
275
-
276
-
277
-
278
-
279
-
280
-
281
-
282
-
283
-
284
-
285
-
286
-
287
-
288
-
289
-
290
-
291
-
292
-
293
-
294
-
295
-
296
-
297
-
298
-
299
-
300
-
301
-
302
-
303
-
304
-
305
-
306
-
307
-
308
-
309
-
310
-
311
-
312
-
313
-
314
-
315
-
316
-
317
-
318
-
319
-
320
-
321
-
322
-
323
-
324
-
325
-
326
-
327
-
328
-
329
-
330
-
331
-
332
 |
 |

2015 REGISTRATION DOCUMENT SCHNEIDER ELECTRIC 217
CONSOLIDATED FINANCIAL STATEMENTS AT DECEMBER31,2015
5
NOTES TO THE CONSOLIDATED FINANCIAL STATEMENTS
Note21
Equity
21.1 – Capital
Share capital
The company’s share capital at December31, 2015 amounted to
EUR2,354,937,888 represented by 588,734,472shares with a par
value of EUR4, all fully paid up.
At December31, 2015, a total of 630,365,631voting rights were
attached to the 588,734,472shares outstanding.
Schneider Electric’s capital management strategy is designed to:
•ensure Group liquidity;
•optimize its fi nancial structure;
•optimize the weighted average cost of capital.
The strategy must also ensure the Group has access to different
capital markets under the best possible conditions. Factors taken
into account for decision-making purposes include objectives
expressed in terms of earnings per share, ratings or balance sheet
stability. Finally, decisions may be implemented depending on
specifi c market conditions.
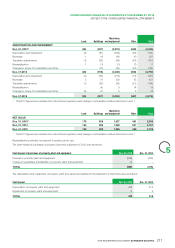
Changes in share capital
Changes in share capital since December31, 2013 were as follows:
Cumulative number of shares Total (in euros)
Capital at Dec.31, 2013 561,958,023 2,247,832,092
Exercise of stock options 1,807,827 7,231,308
Employee share issue 3,717,865 14,871,460
Capital increase 17,207,427 68,829,708
Capital at Dec.31, 2014 584,691,142 2,338,764,568
Exercise of stock options 1,629,391 6,517,564
Employee share issue 2,413,939 9,655,756
CAPITAL AT DEC.31, 2015 588,734,472 2,354,937,888
The share premium account increased by EUR141,015,492following the exercise of options and the increases in capital.
21.2 – Ownership structure
Dec.31, 2015 Dec.31, 2014
Capital % Number of
shares Voting rights % Number of
voting rights Capital % Voting rights %
Blackrock,Inc. 5.0 29,626,692 4.7 29,626,692 5.3 4.9
Capital Group Companies(1) 0.0 7,228 0.0 7,228 4.2 3.9
CDC 3.1 18,270,907 5.8 36,514,997 3.2 6.0
Employees 3.8 22,609,167 6.0 37,551,765 4.0 6.3
Own shares(2) 0.0 1,058 - - 0.0 -
Treasury shares 4.0 23,283,812 - - 2.3 -
Public 84.1 494,935,608 83.5 526,664,949 81.0 78.9
TOTAL 100.0 588,734,472 100.0 630,365,631 100.0 100.0
(1) To the best of the company’s knowledge.
(2) Number of voting rights as defi ned in article223-11 of the AMF general regulations, which includes shares stripped of voting rights.
No shareholders’ pact was in effect as of December31, 2015 .