APC 2015 Annual Report Download - page 203
Download and view the complete annual report
Please find page 203 of the 2015 APC annual report below. You can navigate through the pages in the report by either clicking on the pages listed below, or by using the keyword search tool below to find specific information within the annual report.-
 1
1 -
2
-
3
-
4
-
5
-
6
-
7
-
8
-
9
-
10
-
11
-
12
-
13
-
14
-
15
-
16
-
17
-
18
-
19
-
20
-
21
-
22
-
23
-
24
-
25
-
26
-
27
-
28
-
29
-
30
-
31
-
32
-
33
-
34
-
35
-
36
-
37
-
38
-
39
-
40
-
41
-
42
-
43
-
44
-
45
-
46
-
47
-
48
-
49
-
50
-
51
-
52
-
53
-
54
-
55
-
56
-
57
-
58
-
59
-
60
-
61
-
62
-
63
-
64
-
65
-
66
-
67
-
68
-
69
-
70
-
71
-
72
-
73
-
74
-
75
-
76
-
77
-
78
-
79
-
80
-
81
-
82
-
83
-
84
-
85
-
86
-
87
-
88
-
89
-
90
-
91
-
92
-
93
-
94
-
95
-
96
-
97
-
98
-
99
-
100
-
101
-
102
-
103
-
104
-
105
-
106
-
107
-
108
-
109
-
110
-
111
-
112
-
113
-
114
-
115
-
116
-
117
-
118
-
119
-
120
-
121
-
122
-
123
-
124
-
125
-
126
-
127
-
128
-
129
-
130
-
131
-
132
-
133
-
134
-
135
-
136
-
137
-
138
-
139
-
140
-
141
-
142
-
143
-
144
-
145
-
146
-
147
-
148
-
149
-
150
-
151
-
152
-
153
-
154
-
155
-
156
-
157
-
158
-
159
-
160
-
161
-
162
-
163
-
164
-
165
-
166
-
167
-
168
-
169
-
170
-
171
-
172
-
173
-
174
-
175
-
176
-
177
-
178
-
179
-
180
-
181
-
182
-
183
-
184
-
185
-
186
-
187
-
188
-
189
-
190
-
191
-
192
-
 193
193 -
 194
194 -
 195
195 -
 196
196 -
 197
197 -
 198
198 -
 199
199 -
 200
200 -
 201
201 -
 202
202 -
 203
203 -
 204
204 -
 205
205 -
 206
206 -
 207
207 -
 208
208 -
 209
209 -
 210
210 -
 211
211 -
 212
212 -
 213
213 -
214
-
215
-
216
-
217
-
218
-
219
-
220
-
221
-
222
-
223
-
224
-
225
-
226
-
227
-
228
-
229
-
230
-
231
-
232
-
233
-
234
-
235
-
236
-
237
-
238
-
239
-
240
-
241
-
242
-
243
-
244
-
245
-
246
-
247
-
248
-
249
-
250
-
251
-
252
-
253
-
254
-
255
-
256
-
257
-
258
-
259
-
260
-
261
-
262
-
263
-
264
-
265
-
266
-
267
-
268
-
269
-
270
-
271
-
272
-
273
-
274
-
275
-
276
-
277
-
278
-
279
-
280
-
281
-
282
-
283
-
284
-
285
-
286
-
287
-
288
-
289
-
290
-
291
-
292
-
293
-
294
-
295
-
296
-
297
-
298
-
299
-
300
-
301
-
302
-
303
-
304
-
305
-
306
-
307
-
308
-
309
-
310
-
311
-
312
-
313
-
314
-
315
-
316
-
317
-
318
-
319
-
320
-
321
-
322
-
323
-
324
-
325
-
326
-
327
-
328
-
329
-
330
-
331
-
332
 |
 |

2015 REGISTRATION DOCUMENT SCHNEIDER ELECTRIC 201
CONSOLIDATED FINANCIAL STATEMENTS AT DECEMBER31,2015
5
NOTES TO THE CONSOLIDATED FINANCIAL STATEMENTS
difference between the purchase price of the minority interests
and the share of the net assets acquired as goodwill, without re-
measuring the assets and liabilities acquired. Subsequent changes
in the fair value of the liability are recognized by adjusting goodwill.
The Group opted for accounting subsequent fair value changes of
put options granted to minority shareholders with counterpart in
equity.
1.24 – Revenue recognition
The Group’s revenues primarily include merchandise sales and
revenues from services and contracts.
Merchandise sales
Revenue from sales is recognized when the product is shipped
and risks and benefi ts are transferred (standard shipping terms are
FOB).
Provisions for the discounts offered to distributors are set aside
when the products are sold to the distributor and recognized as a
deduction from revenue.
Certain Group subsidiaries also offer cash discounts to distributors.
These discounts and rebates are deducted from sales.
Consolidated revenue is presented net of these discounts and
rebates.
Service contracts
Revenue from service contracts is recorded over the contractual
period of service. It is recognized when the result of the transaction
can be reliably determined, by the percentage of completion
method.
Long-term contracts
Income from long-term contracts is recognized using the
percentage-of-completion method, based either on the percentage
of costs incurred in relation to total estimated costs of the entire
contract, or on the contract’s technical milestones, notably proof
of installation or delivery of equipment. When a contract includes
performance clauses in the Group’s favor, the related revenue is
recognized at each project milestone and a provision is set aside if
targets are not met.
Losses at completion for a given contract are provided for in full
as soon as they become probable. The cost of work-in-process
includes direct and indirect costs relating to the contracts.
1.25 – Earnings per share
Earnings per share are calculated in accordance with IAS 33 –
Earnings Per Share.
Diluted earnings per share are calculated by adjusting profi t
attributable to equity holders of the parent and the weighted average
number of shares outstanding for the dilutive effect of the exercise
of stock options outstanding at the balance sheet date. The dilutive
effect of stock options is determined by applying the « treasury
stock»method, which consists of taking into account the number
of shares that could be purchased, based on the average share
price for the year, using the proceeds from the exercise of the rights
attached to the options.
1.26 – Statement of cash flows
The consolidated statement of cash fl ows has been prepared
using the indirect method, which consists of reconciling net profi t
to net cash provided by operations. The opening and closing
cash positions include cash and cash equivalents, comprised
of marketable securities, (note 1.20) net of bank overdrafts
andfacilities.
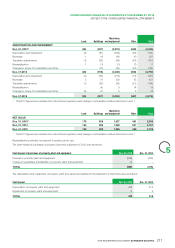
Note2
Changes in the scope of consolidation
The Group’s consolidated fi nancial statements for the year ended December31, 2015 enclose the fi nancial statements of companies listed
in the note32. The scope of consolidation for the year ended December31, 2015 can be summarized as follows:
Number of active companies Dec.31, 2015 Dec.31, 2014
Parent company and fully consolidated subsidiaries 603 607
Companies accounted for by the equity method 9 8
TOTAL 612 615
2.1 – Follow-up on acquisitions
anddivestments occurred in 2014
withsignificant effect in 2015
On January17, 2014, the Group took control of Invensys group.
Invensys has been fully consolidated mainly in the Industry business
since January 2014, except its Appliance division (divested in
June2014) reported as discontinued operations over the fi rst half
of 2014.
In accordance with IFRS3 revised , Schneider Electric valued the
assets acquired and liabilities assumed at their fair value on the date
of acquisition.
The accounting of the acquisition of Invensys led principally to the
recognition of intangibles at their fair value for a total amount of
EUR501million (technology, customer relationships and trademarks)
and step down of tangibles in the amount of EUR(18) million;
these assets were valued by independent experts. Provisions and
contingent liabilities were recognized respectively for a total amount