APC 2015 Annual Report Download - page 205
Download and view the complete annual report
Please find page 205 of the 2015 APC annual report below. You can navigate through the pages in the report by either clicking on the pages listed below, or by using the keyword search tool below to find specific information within the annual report.-
 1
1 -
2
-
3
-
4
-
5
-
6
-
7
-
8
-
9
-
10
-
11
-
12
-
13
-
14
-
15
-
16
-
17
-
18
-
19
-
20
-
21
-
22
-
23
-
24
-
25
-
26
-
27
-
28
-
29
-
30
-
31
-
32
-
33
-
34
-
35
-
36
-
37
-
38
-
39
-
40
-
41
-
42
-
43
-
44
-
45
-
46
-
47
-
48
-
49
-
50
-
51
-
52
-
53
-
54
-
55
-
56
-
57
-
58
-
59
-
60
-
61
-
62
-
63
-
64
-
65
-
66
-
67
-
68
-
69
-
70
-
71
-
72
-
73
-
74
-
75
-
76
-
77
-
78
-
79
-
80
-
81
-
82
-
83
-
84
-
85
-
86
-
87
-
88
-
89
-
90
-
91
-
92
-
93
-
94
-
95
-
96
-
97
-
98
-
99
-
100
-
101
-
102
-
103
-
104
-
105
-
106
-
107
-
108
-
109
-
110
-
111
-
112
-
113
-
114
-
115
-
116
-
117
-
118
-
119
-
120
-
121
-
122
-
123
-
124
-
125
-
126
-
127
-
128
-
129
-
130
-
131
-
132
-
133
-
134
-
135
-
136
-
137
-
138
-
139
-
140
-
141
-
142
-
143
-
144
-
145
-
146
-
147
-
148
-
149
-
150
-
151
-
152
-
153
-
154
-
155
-
156
-
157
-
158
-
159
-
160
-
161
-
162
-
163
-
164
-
165
-
166
-
167
-
168
-
169
-
170
-
171
-
172
-
173
-
174
-
175
-
176
-
177
-
178
-
179
-
180
-
181
-
182
-
183
-
184
-
185
-
186
-
187
-
188
-
189
-
190
-
191
-
192
-
193
-
194
-
 195
195 -
 196
196 -
 197
197 -
 198
198 -
 199
199 -
 200
200 -
 201
201 -
 202
202 -
 203
203 -
 204
204 -
 205
205 -
 206
206 -
 207
207 -
 208
208 -
 209
209 -
 210
210 -
 211
211 -
 212
212 -
 213
213 -
 214
214 -
 215
215 -
216
-
217
-
218
-
219
-
220
-
221
-
222
-
223
-
224
-
225
-
226
-
227
-
228
-
229
-
230
-
231
-
232
-
233
-
234
-
235
-
236
-
237
-
238
-
239
-
240
-
241
-
242
-
243
-
244
-
245
-
246
-
247
-
248
-
249
-
250
-
251
-
252
-
253
-
254
-
255
-
256
-
257
-
258
-
259
-
260
-
261
-
262
-
263
-
264
-
265
-
266
-
267
-
268
-
269
-
270
-
271
-
272
-
273
-
274
-
275
-
276
-
277
-
278
-
279
-
280
-
281
-
282
-
283
-
284
-
285
-
286
-
287
-
288
-
289
-
290
-
291
-
292
-
293
-
294
-
295
-
296
-
297
-
298
-
299
-
300
-
301
-
302
-
303
-
304
-
305
-
306
-
307
-
308
-
309
-
310
-
311
-
312
-
313
-
314
-
315
-
316
-
317
-
318
-
319
-
320
-
321
-
322
-
323
-
324
-
325
-
326
-
327
-
328
-
329
-
330
-
331
-
332
 |
 |

2015 REGISTRATION DOCUMENT SCHNEIDER ELECTRIC 203
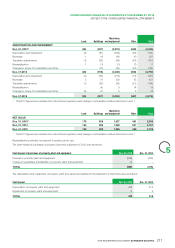
CONSOLIDATED FINANCIAL STATEMENTS AT DECEMBER31,2015
5
NOTES TO THE CONSOLIDATED FINANCIAL STATEMENTS
3.1 – Information by operating segment
Full year 2015
(inmillions of euros) Buildings& Partner Industry Infrastructure IT Corporate costs Total
Revenue 11,859 5,696 5,428 3,657 - 26,640
Adjusted EBITA* 2,132 975 495 644 (605) 3,641
Adjusted EBITA % 18.0% 17.1% 9.1% 17.6% - 13.7%
Other operating income
andexpense (240) (22) (240) (5) (15) (522)
Restructuring costs (169) (22) (89) (8) (30) (318)
EBITA 1,723 931 166 631 (650) 2,801
EBITA % 14.5% 16.4% 3.1% 17.3% - 10.5%
* Adjusted EBITA: EBITA before r estructuring costs and before o ther operating income and expenses (including acquisition, integration
and separation costs).
Revenue related to solutions amounts to 43% of total revenue in2015.
Full year 2014
(inmillions of euros) Buildings& Partner Industry Infrastructure IT Corporate costs Total
Revenue 10,754 5,551 5,277 3,357 - 24,939
Adjusted EBITA* 1,913 1,023 454 630 (557) 3,463
Adjusted EBITA % 17.8% 18.4% 8.6% 18.8% - 13.9%
Other operating income
andexpense 7 (34) (86) 1 6 (106)
Restructuring costs (93) (26) (76) (4) (3) (202)
EBITA 1,827 963 292 627 (554) 3,155
EBITA % 17.0% 17.3% 5.5% 18.7% - 12.7%
* Adjusted EBITA: EBITA before r estructuring costs and before o ther operating income and expenses (including acquisition, integration
and separation costs).
Revenue related to solutions amounts to 43% of total revenue in2014.
3.2 – Information by region
The geographic regions covered by the Group are:
•Western Europe;
•North America: United States, Canada and Mexico;
•Asia-Pacifi c;
•Rest of the World (Eastern Europe, Middle East, Africa, South America).
Non-current assets include net goodwill, net intangible assets and net property, plant and equipment.
Dec.31, 2015
Western
Europe of which
France North
America of which
USA Asia-
Pacifi c of which
China Rest of
theworld Total
Revenue by country market 6,929 1,711 7,268 6,083 7,599 3,892 4,844 26,640
Non-current assets 10,017 1,739 9,213 8,591 4,771 1,596 1,235 25,236