APC 2015 Annual Report Download - page 6
Download and view the complete annual report
Please find page 6 of the 2015 APC annual report below. You can navigate through the pages in the report by either clicking on the pages listed below, or by using the keyword search tool below to find specific information within the annual report.-
 1
1 -
 2
2 -
 3
3 -
 4
4 -
 5
5 -
 6
6 -
 7
7 -
 8
8 -
 9
9 -
 10
10 -
 11
11 -
 12
12 -
 13
13 -
 14
14 -
 15
15 -
 16
16 -
 17
17 -
18
-
19
-
20
-
21
-
22
-
23
-
24
-
25
-
26
-
27
-
28
-
29
-
30
-
31
-
32
-
33
-
34
-
35
-
36
-
37
-
38
-
39
-
40
-
41
-
42
-
43
-
44
-
45
-
46
-
47
-
48
-
49
-
50
-
51
-
52
-
53
-
54
-
55
-
56
-
57
-
58
-
59
-
60
-
61
-
62
-
63
-
64
-
65
-
66
-
67
-
68
-
69
-
70
-
71
-
72
-
73
-
74
-
75
-
76
-
77
-
78
-
79
-
80
-
81
-
82
-
83
-
84
-
85
-
86
-
87
-
88
-
89
-
90
-
91
-
92
-
93
-
94
-
95
-
96
-
97
-
98
-
99
-
100
-
101
-
102
-
103
-
104
-
105
-
106
-
107
-
108
-
109
-
110
-
111
-
112
-
113
-
114
-
115
-
116
-
117
-
118
-
119
-
120
-
121
-
122
-
123
-
124
-
125
-
126
-
127
-
128
-
129
-
130
-
131
-
132
-
133
-
134
-
135
-
136
-
137
-
138
-
139
-
140
-
141
-
142
-
143
-
144
-
145
-
146
-
147
-
148
-
149
-
150
-
151
-
152
-
153
-
154
-
155
-
156
-
157
-
158
-
159
-
160
-
161
-
162
-
163
-
164
-
165
-
166
-
167
-
168
-
169
-
170
-
171
-
172
-
173
-
174
-
175
-
176
-
177
-
178
-
179
-
180
-
181
-
182
-
183
-
184
-
185
-
186
-
187
-
188
-
189
-
190
-
191
-
192
-
193
-
194
-
195
-
196
-
197
-
198
-
199
-
200
-
201
-
202
-
203
-
204
-
205
-
206
-
207
-
208
-
209
-
210
-
211
-
212
-
213
-
214
-
215
-
216
-
217
-
218
-
219
-
220
-
221
-
222
-
223
-
224
-
225
-
226
-
227
-
228
-
229
-
230
-
231
-
232
-
233
-
234
-
235
-
236
-
237
-
238
-
239
-
240
-
241
-
242
-
243
-
244
-
245
-
246
-
247
-
248
-
249
-
250
-
251
-
252
-
253
-
254
-
255
-
256
-
257
-
258
-
259
-
260
-
261
-
262
-
263
-
264
-
265
-
266
-
267
-
268
-
269
-
270
-
271
-
272
-
273
-
274
-
275
-
276
-
277
-
278
-
279
-
280
-
281
-
282
-
283
-
284
-
285
-
286
-
287
-
288
-
289
-
290
-
291
-
292
-
293
-
294
-
295
-
296
-
297
-
298
-
299
-
300
-
301
-
302
-
303
-
304
-
305
-
306
-
307
-
308
-
309
-
310
-
311
-
312
-
313
-
314
-
315
-
316
-
317
-
318
-
319
-
320
-
321
-
322
-
323
-
324
-
325
-
326
-
327
-
328
-
329
-
330
-
331
-
332
 |
 |

2015 REGISTRATION DOCUMENT SCHNEIDER ELECTRIC4
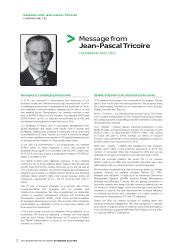
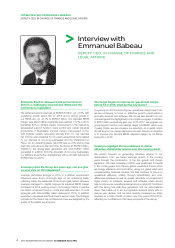
INTERVIEW WITH EMMANUELBABEAU
DEPUTY CEO, IN CHARGE OF FINANCE AND LEGAL AFFAIRS
>
Interview with
EmmanuelBabeau
DEPUTY CEO, IN CHARGE OF FINANCE AND
LEGAL AFFAIRS
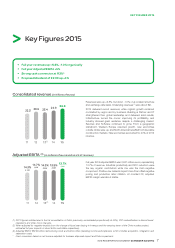
Schneider Electric delivered solid performance in
2015 in a challenging environment. What were the
performance highlights?
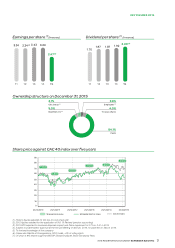
We achieved record revenues of EUR 26.6billion , up +6.8% with
underlying growth about fl at for 2015 and a strong growth in
our EBITA adj., up +5.1% to EUR3.6billion . Our Adjusted EBITA
margin was about stable organically and reached 13.7% in 2015,
benefi ting from a c.50bps organic improvement in H2, helped by
accelerated s upport f unction c osts control and robust industrial
productivity. 3 Businesses showed margin improvement in H2,
with Industry notably recovering strongly from H1. Our reported
net income was impacted by non-cash exceptional items related
to our disposal of non-core businesses and the impairment on
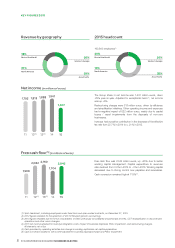
Pelco. On an underlying basis, net profi t was up +6% and our free
cash fl ow was close to the record for the Group at EUR 2.0 billion.
Thanks to this strong cash generation and circa EUR 47 million
generated in addition from the disposals of non-core businesses,
our balance sheet further strengthened with a net debt reduced to
EUR 4.6billion in 2015.
Invensys joined the Group two years ago, can you give
us your view on the integration?
Invensys performed strongly in 2015 in a diffi cult environment.
Revenues were down mid-single digit on an underlying basis,
refl ecting mainly the weakness of the oil and gas market. However
Invensys managed to slightly improve its adjusted EBITA margin
compared to 2014, posting close to 15% margin thanks to positive
mix effect, continued focus on costs and solid execution of costs
synergies with c irca EUR 55 million delivered in 2015. In addition
execution of revenues and fi scal ones is well on track. The strategic
rationale for the deal is fully confi rmed and we are delighted by the
quality of the assets we acquired.
The Group targets to improve its operational margin
before FX in 2016, what are the key levers?
Our priority for 2016 is improving our operational margin level. First,
we are continuing to focus on attractive growth opportunities in
products, services and software. We should also benefi t from our
cost savings actions highlighted in our company program: in addition
to EUR 1billion productivity gain over 2015-2017, we upgrade our
gross support function cost savings target to EUR 600million over
3 years. Finally, we also increase our selectivity on projects, which
should support our margin expansion as well. Overall our objective
is to improve the Group’s EBITA adjusted margin by 20-60bps
before FX in 2016.
Could you highlight the key initiatives to deliver
attractive shareholder returns over the coming years?
We remain focused on generating attractive returns to our
shareholders. First, we target earnings growth in the coming
years through the combination of top line growth and margin
expansion. We have a leading portfolio, well positioned to benefi t
in the coming years from the key global investment drivers which
are energy effi ciency and automation, using our global reach and
complementary business models. We also continue to focus on
operational effi ciency notably through simplifi cation and cost-
effi ciencies initiatives as well as greater selectivity on projects and
higher priority on products, services and software, which should
help to improve our operational margin and our net profi t. Combined
with the strong free cash-fl ow generation and our solid balance
sheet, this enable us to set a progressive dividend policy with no
year-on-year decline, and we have recently increased our share
buyback to a total of EUR 1.5 billion over the period 2015-2016,
refl ecting our confi dence in the future prospects of the Group.