APC 2015 Annual Report Download - page 50
Download and view the complete annual report
Please find page 50 of the 2015 APC annual report below. You can navigate through the pages in the report by either clicking on the pages listed below, or by using the keyword search tool below to find specific information within the annual report.-
 1
1 -
2
-
3
-
4
-
5
-
6
-
7
-
8
-
9
-
10
-
11
-
12
-
13
-
14
-
15
-
16
-
17
-
18
-
19
-
20
-
21
-
22
-
23
-
24
-
25
-
26
-
27
-
28
-
29
-
30
-
31
-
32
-
33
-
34
-
35
-
36
-
37
-
38
-
39
-
 40
40 -
 41
41 -
 42
42 -
 43
43 -
 44
44 -
 45
45 -
 46
46 -
 47
47 -
 48
48 -
 49
49 -
 50
50 -
 51
51 -
 52
52 -
 53
53 -
 54
54 -
 55
55 -
 56
56 -
 57
57 -
 58
58 -
 59
59 -
 60
60 -
61
-
62
-
63
-
64
-
65
-
66
-
67
-
68
-
69
-
70
-
71
-
72
-
73
-
74
-
75
-
76
-
77
-
78
-
79
-
80
-
81
-
82
-
83
-
84
-
85
-
86
-
87
-
88
-
89
-
90
-
91
-
92
-
93
-
94
-
95
-
96
-
97
-
98
-
99
-
100
-
101
-
102
-
103
-
104
-
105
-
106
-
107
-
108
-
109
-
110
-
111
-
112
-
113
-
114
-
115
-
116
-
117
-
118
-
119
-
120
-
121
-
122
-
123
-
124
-
125
-
126
-
127
-
128
-
129
-
130
-
131
-
132
-
133
-
134
-
135
-
136
-
137
-
138
-
139
-
140
-
141
-
142
-
143
-
144
-
145
-
146
-
147
-
148
-
149
-
150
-
151
-
152
-
153
-
154
-
155
-
156
-
157
-
158
-
159
-
160
-
161
-
162
-
163
-
164
-
165
-
166
-
167
-
168
-
169
-
170
-
171
-
172
-
173
-
174
-
175
-
176
-
177
-
178
-
179
-
180
-
181
-
182
-
183
-
184
-
185
-
186
-
187
-
188
-
189
-
190
-
191
-
192
-
193
-
194
-
195
-
196
-
197
-
198
-
199
-
200
-
201
-
202
-
203
-
204
-
205
-
206
-
207
-
208
-
209
-
210
-
211
-
212
-
213
-
214
-
215
-
216
-
217
-
218
-
219
-
220
-
221
-
222
-
223
-
224
-
225
-
226
-
227
-
228
-
229
-
230
-
231
-
232
-
233
-
234
-
235
-
236
-
237
-
238
-
239
-
240
-
241
-
242
-
243
-
244
-
245
-
246
-
247
-
248
-
249
-
250
-
251
-
252
-
253
-
254
-
255
-
256
-
257
-
258
-
259
-
260
-
261
-
262
-
263
-
264
-
265
-
266
-
267
-
268
-
269
-
270
-
271
-
272
-
273
-
274
-
275
-
276
-
277
-
278
-
279
-
280
-
281
-
282
-
283
-
284
-
285
-
286
-
287
-
288
-
289
-
290
-
291
-
292
-
293
-
294
-
295
-
296
-
297
-
298
-
299
-
300
-
301
-
302
-
303
-
304
-
305
-
306
-
307
-
308
-
309
-
310
-
311
-
312
-
313
-
314
-
315
-
316
-
317
-
318
-
319
-
320
-
321
-
322
-
323
-
324
-
325
-
326
-
327
-
328
-
329
-
330
-
331
-
332
 |
 |

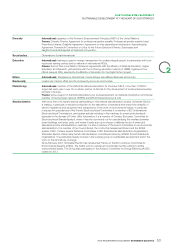
2015 REGISTRATION DOCUMENT SCHNEIDER ELECTRIC48
SUSTAINABLE DEVELOPMENT
2SUSTAINABLE DEVELOPMENT ATTHEHEART OFOURSTRATEGY
Overall score (out of10)
Planet & Society barometer
(objectives for 2017)
-
-
34
-
Start
01/2015
3.00
4.5% S
8.4% S
64 S
13.3% S
Results
2015
6.33
Target
12/2017
8/10
10%
10%
100
100%
PLANET
CLIMATE
60.5%
-
-
-
48%
-
67.1% S
- *
44,777 S
x 2.07 S
64.7% S
88% S
75%
100%
120,000
x 5
100%
100%
PROFIT
CIRCULAR
ECONOMY
CLIMATE +
DEVELOPMENT
(Sustainability
offers)
ETHICS
575% of product revenue with Green PremiumTM eco-label
6100% of new large customer projects with CO2 impact quantification
7120,000 tons of CO2 avoided through maintenance,
retrofit and end-of-life services
8x5 turnover of Access to Energy program to promote development
9100% of our recommended suppliers embrace ISO 26000 guidelines
10All our entities pass our internal Ethics & Responsibility assessment
-
79%
61%
-
73,339
460
17% S
85.6%S
61% S
57% S
102,884 S
878 S
30%
85%
64%
85%
150,000
1,300
PEOPLE
DEVELOPMENT
HEALTH
& EQUITY
1130% reduction in the Medical Incident Rate (MIR)
12One day training for every employee every year
1364% scored in our Employee Engagement Index
1485% of employees work in countries with Schneider gender
pay equity plan
15150,000 underprivileged people trained in energy management
161,300 missions within Schneider Electric Teachers NGO
The 2014 performance serves as a starting value for the Planet & Society barometer of the Schneider is On company program
between 2015 and 2017
S 2015 audited indicators
* This indicators will be followed from 2016
110% energy savings
210% CO2 savings from transportation
3Towards zero waste to landfill for 100 industrial sites
4100% of products in R&D designed with Schneider ecoDesign WayTM
1.2 The Planet&Society barometer , a regular and objective measure
oftheGroup’s actions
Process to select and prioritize commitments
Schneider Electric has used the Planet & Society barometer as
its sustainable development dashboard since 2005. To have
a signifi cant impact and initiate lasting change, a performance
measure is required. That is why Schneider Electric defi nes specifi c
objectives and measures its results each quarter. The action plans
of the barometer are carried out at the Group level.
There are no recognized standards that defi ne an organization’s
sustainable development performance. The Planet & Society
barometer is Schneider Electric’s response to this matter. It allows
the Group to meet its sustainability challenges and advance on
the three pillars (Planet, Profi t and People). The barometer uses
a scoring scale of 10 and provides an overall measure of Group
improvement in sustainable development.
The aim of the Planet&Society barometer is to:
•mobilize the corporate community around sustainable
development objectives;
•share the Group’s progress plans with stakeholders.
On a daily basis, the Group seeks to prove that economic,
environmental and social interests are convergent.
For each company program, the Group defi nes a new
Planet & Society barometer . The progress plans are elaborated
following an internal exercise to identify sustainability issues
based on external inputs, primarily the assessments and ratings
received along with the materiality matrix, and a consultation
with the departments directly concerned by the progress plans.
In 2014, this also included a company-internal consultation with
the «sustainability fellows» (see page51 ) and the «sustainability
leaders» appointed by each member of the Executive Committee.
The Sustainable Development Department presents the draft