APC 2015 Annual Report Download - page 206
Download and view the complete annual report
Please find page 206 of the 2015 APC annual report below. You can navigate through the pages in the report by either clicking on the pages listed below, or by using the keyword search tool below to find specific information within the annual report.-
 1
1 -
2
-
3
-
4
-
5
-
6
-
7
-
8
-
9
-
10
-
11
-
12
-
13
-
14
-
15
-
16
-
17
-
18
-
19
-
20
-
21
-
22
-
23
-
24
-
25
-
26
-
27
-
28
-
29
-
30
-
31
-
32
-
33
-
34
-
35
-
36
-
37
-
38
-
39
-
40
-
41
-
42
-
43
-
44
-
45
-
46
-
47
-
48
-
49
-
50
-
51
-
52
-
53
-
54
-
55
-
56
-
57
-
58
-
59
-
60
-
61
-
62
-
63
-
64
-
65
-
66
-
67
-
68
-
69
-
70
-
71
-
72
-
73
-
74
-
75
-
76
-
77
-
78
-
79
-
80
-
81
-
82
-
83
-
84
-
85
-
86
-
87
-
88
-
89
-
90
-
91
-
92
-
93
-
94
-
95
-
96
-
97
-
98
-
99
-
100
-
101
-
102
-
103
-
104
-
105
-
106
-
107
-
108
-
109
-
110
-
111
-
112
-
113
-
114
-
115
-
116
-
117
-
118
-
119
-
120
-
121
-
122
-
123
-
124
-
125
-
126
-
127
-
128
-
129
-
130
-
131
-
132
-
133
-
134
-
135
-
136
-
137
-
138
-
139
-
140
-
141
-
142
-
143
-
144
-
145
-
146
-
147
-
148
-
149
-
150
-
151
-
152
-
153
-
154
-
155
-
156
-
157
-
158
-
159
-
160
-
161
-
162
-
163
-
164
-
165
-
166
-
167
-
168
-
169
-
170
-
171
-
172
-
173
-
174
-
175
-
176
-
177
-
178
-
179
-
180
-
181
-
182
-
183
-
184
-
185
-
186
-
187
-
188
-
189
-
190
-
191
-
192
-
193
-
194
-
195
-
 196
196 -
 197
197 -
 198
198 -
 199
199 -
 200
200 -
 201
201 -
 202
202 -
 203
203 -
 204
204 -
 205
205 -
 206
206 -
 207
207 -
 208
208 -
 209
209 -
 210
210 -
 211
211 -
 212
212 -
 213
213 -
 214
214 -
 215
215 -
 216
216 -
217
-
218
-
219
-
220
-
221
-
222
-
223
-
224
-
225
-
226
-
227
-
228
-
229
-
230
-
231
-
232
-
233
-
234
-
235
-
236
-
237
-
238
-
239
-
240
-
241
-
242
-
243
-
244
-
245
-
246
-
247
-
248
-
249
-
250
-
251
-
252
-
253
-
254
-
255
-
256
-
257
-
258
-
259
-
260
-
261
-
262
-
263
-
264
-
265
-
266
-
267
-
268
-
269
-
270
-
271
-
272
-
273
-
274
-
275
-
276
-
277
-
278
-
279
-
280
-
281
-
282
-
283
-
284
-
285
-
286
-
287
-
288
-
289
-
290
-
291
-
292
-
293
-
294
-
295
-
296
-
297
-
298
-
299
-
300
-
301
-
302
-
303
-
304
-
305
-
306
-
307
-
308
-
309
-
310
-
311
-
312
-
313
-
314
-
315
-
316
-
317
-
318
-
319
-
320
-
321
-
322
-
323
-
324
-
325
-
326
-
327
-
328
-
329
-
330
-
331
-
332
 |
 |

2015 REGISTRATION DOCUMENT SCHNEIDER ELECTRIC204
CONSOLIDATED FINANCIAL STATEMENTS AT DECEMBER31,2015
5NOTES TO THE CONSOLIDATED FINANCIAL STATEMENTS
Dec.31, 2014
Western
Europe of which
France North
America of which
USA Asia-
Pacifi c of which
China Rest of
theworld Total
Revenue by country market 6,758 1,644 6,321 5,239 7,076 3,705 4,784 24,939
Non-current assets 9,848 1,761 8,981 8,748 4,544 1,532 1,172 24,545
Moreover, the Group follows the share of new economies by revenue:
Full year 2015 Full year 2014
Revenue– Mature countries 15,111 57% 13,994 56%
Revenue– New economies 11,529 43% 10,945 44%
TOTAL 26,640 100% 24,939 100%
3.3 – Degree of dependence in relation to main customers
No single customer accounts for more than 10% of consolidated revenue.
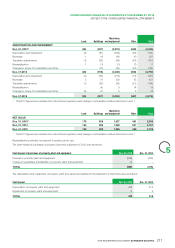
Note4
Research and development
Research and development costs break down as follows:
Full year 2015 Full year 2014
Research and development costs in cost of sales (335) (290)
Research and development costs in R&D costs(1) (565) (567)
Capitalized development costs (372) (355)
TOTAL RESEARCH AND DEVELOPMENT COSTS IN THE YEAR (1,272) (1,212)
(1) Of which EUR47million of research and development tax credits in full year 2015, EUR45million in full year 2014.
Amortization of capitalized development costs amounted to EUR227million for the 2015 fi nancial year, compared with EUR180million in 2014.
Note5
Depreciation and amortization expenses
Depreciation and amortization expenses recognized in operating expenses were as follows:
Full year 2015 Full year 2014
Included in cost of sales:
Depreciation and amortization (554) (484)
Included in selling, general and administrative expenses
Depreciation and amortization (203) (141)
DEPRECIATION AND AMORTIZATION EXPENSES (757) (625)
Moreover, the net amount of impairment of non-current assets totaled EUR482million.