APC 2015 Annual Report Download - page 212
Download and view the complete annual report
Please find page 212 of the 2015 APC annual report below. You can navigate through the pages in the report by either clicking on the pages listed below, or by using the keyword search tool below to find specific information within the annual report.-
 1
1 -
2
-
3
-
4
-
5
-
6
-
7
-
8
-
9
-
10
-
11
-
12
-
13
-
14
-
15
-
16
-
17
-
18
-
19
-
20
-
21
-
22
-
23
-
24
-
25
-
26
-
27
-
28
-
29
-
30
-
31
-
32
-
33
-
34
-
35
-
36
-
37
-
38
-
39
-
40
-
41
-
42
-
43
-
44
-
45
-
46
-
47
-
48
-
49
-
50
-
51
-
52
-
53
-
54
-
55
-
56
-
57
-
58
-
59
-
60
-
61
-
62
-
63
-
64
-
65
-
66
-
67
-
68
-
69
-
70
-
71
-
72
-
73
-
74
-
75
-
76
-
77
-
78
-
79
-
80
-
81
-
82
-
83
-
84
-
85
-
86
-
87
-
88
-
89
-
90
-
91
-
92
-
93
-
94
-
95
-
96
-
97
-
98
-
99
-
100
-
101
-
102
-
103
-
104
-
105
-
106
-
107
-
108
-
109
-
110
-
111
-
112
-
113
-
114
-
115
-
116
-
117
-
118
-
119
-
120
-
121
-
122
-
123
-
124
-
125
-
126
-
127
-
128
-
129
-
130
-
131
-
132
-
133
-
134
-
135
-
136
-
137
-
138
-
139
-
140
-
141
-
142
-
143
-
144
-
145
-
146
-
147
-
148
-
149
-
150
-
151
-
152
-
153
-
154
-
155
-
156
-
157
-
158
-
159
-
160
-
161
-
162
-
163
-
164
-
165
-
166
-
167
-
168
-
169
-
170
-
171
-
172
-
173
-
174
-
175
-
176
-
177
-
178
-
179
-
180
-
181
-
182
-
183
-
184
-
185
-
186
-
187
-
188
-
189
-
190
-
191
-
192
-
193
-
194
-
195
-
196
-
197
-
198
-
199
-
200
-
201
-
 202
202 -
 203
203 -
 204
204 -
 205
205 -
 206
206 -
 207
207 -
 208
208 -
 209
209 -
 210
210 -
 211
211 -
 212
212 -
 213
213 -
 214
214 -
 215
215 -
 216
216 -
 217
217 -
 218
218 -
 219
219 -
 220
220 -
 221
221 -
 222
222 -
223
-
224
-
225
-
226
-
227
-
228
-
229
-
230
-
231
-
232
-
233
-
234
-
235
-
236
-
237
-
238
-
239
-
240
-
241
-
242
-
243
-
244
-
245
-
246
-
247
-
248
-
249
-
250
-
251
-
252
-
253
-
254
-
255
-
256
-
257
-
258
-
259
-
260
-
261
-
262
-
263
-
264
-
265
-
266
-
267
-
268
-
269
-
270
-
271
-
272
-
273
-
274
-
275
-
276
-
277
-
278
-
279
-
280
-
281
-
282
-
283
-
284
-
285
-
286
-
287
-
288
-
289
-
290
-
291
-
292
-
293
-
294
-
295
-
296
-
297
-
298
-
299
-
300
-
301
-
302
-
303
-
304
-
305
-
306
-
307
-
308
-
309
-
310
-
311
-
312
-
313
-
314
-
315
-
316
-
317
-
318
-
319
-
320
-
321
-
322
-
323
-
324
-
325
-
326
-
327
-
328
-
329
-
330
-
331
-
332
 |
 |

2015 REGISTRATION DOCUMENT SCHNEIDER ELECTRIC210
CONSOLIDATED FINANCIAL STATEMENTS AT DECEMBER31,2015
5NOTES TO THE CONSOLIDATED FINANCIAL STATEMENTS
12.2 – Trademarks
At December31, 2015, the main trademarks recognized were as follows:
Dec.31, 2015 Dec.31, 2014
APC (IT) 1,689 1,515
PELCO (Buildings& Partner) 154 410
Clipsal (Buildings& Partner) 171 172
MGE (IT) -33
TAC (Buildings& Partner) -20
Juno (Buildings& Partner) -94
Digital (Industry) 42 38
Invensys– Triconex and Foxboro (Industry) 51 43
Other 134 135
NET 2,241 2,460
The migration of the Group’s brands towards the Schneider Electric
brand (One Brand project) has led to the amortization from January1,
2010 of the Xantrex, TAC and MGE brands over a six-year period.
The corresponding amortization expense totaled EUR61 million
over theyear. The other brands have an indefi nite useful life. The
Pelco brand was impaired in the amount of EUR295million.
Note13
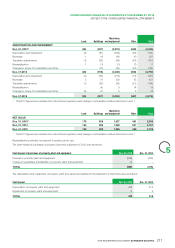
Property, plant and equipment
13.1 – Change in property, plant and equipment
Land Buildings Machinery
andequipment Other Total
GROSS VALUE
Dec.31, 2013* 205 1,745 4,001 989 6,940
Acquisitions 2 269 134 70 475
Disposals 3 (115) (171) (56) (339)
Translation adjustments 11 62 133 35 241
Reclassifi cation 6 (172) 122 38 (6)
Changes in scope of consolidation and other (15) 127 79 39 230
Dec.31,2014 212 1,916 4,298 1,115 7,541
Acquisitions 3 276 162 67 508
Disposals (20) (147) (240) (106) (513)
Translation adjustments 11 56 115 27 209
Reclassifi cation 9 (95) 95 (27) (18)
Changes in scope of consolidation and other (6) (100) (12) (4) (122)
Dec.31,2015 209 1,906 4,418 1,072 7,605
* The 2013 fi gures were restated from discontinued operations and change in consolidation method disclosed in note1.