APC 2015 Annual Report Download - page 204
Download and view the complete annual report
Please find page 204 of the 2015 APC annual report below. You can navigate through the pages in the report by either clicking on the pages listed below, or by using the keyword search tool below to find specific information within the annual report.-
 1
1 -
2
-
3
-
4
-
5
-
6
-
7
-
8
-
9
-
10
-
11
-
12
-
13
-
14
-
15
-
16
-
17
-
18
-
19
-
20
-
21
-
22
-
23
-
24
-
25
-
26
-
27
-
28
-
29
-
30
-
31
-
32
-
33
-
34
-
35
-
36
-
37
-
38
-
39
-
40
-
41
-
42
-
43
-
44
-
45
-
46
-
47
-
48
-
49
-
50
-
51
-
52
-
53
-
54
-
55
-
56
-
57
-
58
-
59
-
60
-
61
-
62
-
63
-
64
-
65
-
66
-
67
-
68
-
69
-
70
-
71
-
72
-
73
-
74
-
75
-
76
-
77
-
78
-
79
-
80
-
81
-
82
-
83
-
84
-
85
-
86
-
87
-
88
-
89
-
90
-
91
-
92
-
93
-
94
-
95
-
96
-
97
-
98
-
99
-
100
-
101
-
102
-
103
-
104
-
105
-
106
-
107
-
108
-
109
-
110
-
111
-
112
-
113
-
114
-
115
-
116
-
117
-
118
-
119
-
120
-
121
-
122
-
123
-
124
-
125
-
126
-
127
-
128
-
129
-
130
-
131
-
132
-
133
-
134
-
135
-
136
-
137
-
138
-
139
-
140
-
141
-
142
-
143
-
144
-
145
-
146
-
147
-
148
-
149
-
150
-
151
-
152
-
153
-
154
-
155
-
156
-
157
-
158
-
159
-
160
-
161
-
162
-
163
-
164
-
165
-
166
-
167
-
168
-
169
-
170
-
171
-
172
-
173
-
174
-
175
-
176
-
177
-
178
-
179
-
180
-
181
-
182
-
183
-
184
-
185
-
186
-
187
-
188
-
189
-
190
-
191
-
192
-
193
-
 194
194 -
 195
195 -
 196
196 -
 197
197 -
 198
198 -
 199
199 -
 200
200 -
 201
201 -
 202
202 -
 203
203 -
 204
204 -
 205
205 -
 206
206 -
 207
207 -
 208
208 -
 209
209 -
 210
210 -
 211
211 -
 212
212 -
 213
213 -
 214
214 -
215
-
216
-
217
-
218
-
219
-
220
-
221
-
222
-
223
-
224
-
225
-
226
-
227
-
228
-
229
-
230
-
231
-
232
-
233
-
234
-
235
-
236
-
237
-
238
-
239
-
240
-
241
-
242
-
243
-
244
-
245
-
246
-
247
-
248
-
249
-
250
-
251
-
252
-
253
-
254
-
255
-
256
-
257
-
258
-
259
-
260
-
261
-
262
-
263
-
264
-
265
-
266
-
267
-
268
-
269
-
270
-
271
-
272
-
273
-
274
-
275
-
276
-
277
-
278
-
279
-
280
-
281
-
282
-
283
-
284
-
285
-
286
-
287
-
288
-
289
-
290
-
291
-
292
-
293
-
294
-
295
-
296
-
297
-
298
-
299
-
300
-
301
-
302
-
303
-
304
-
305
-
306
-
307
-
308
-
309
-
310
-
311
-
312
-
313
-
314
-
315
-
316
-
317
-
318
-
319
-
320
-
321
-
322
-
323
-
324
-
325
-
326
-
327
-
328
-
329
-
330
-
331
-
332
 |
 |

2015 REGISTRATION DOCUMENT SCHNEIDER ELECTRIC202
CONSOLIDATED FINANCIAL STATEMENTS AT DECEMBER31,2015
5NOTES TO THE CONSOLIDATED FINANCIAL STATEMENTS
of EUR160million and EUR476million, the increase in contingent
liabilities reported in the period results from fi nal valuation of risks
identifi ed on December31, 2014 in the 12months period following
the acquisition. The goodwill is not tax-deductible.
Comparative data in2014 did not require a change in2015 because
the impacts related to changes in fair value recognized as part of the
acquisition price were not signifi cant across the Schneider Electric
Group balance sheet and income statement.
On October1, 2014 the Group has fi nalized the sale of Custom
Sensors& Technologies (CST) and it has reinvested approximately
USD100million alongside investment funds and CST management
to hold a shareholding of 30% of CST. CST was reported in
the Industry business of Schneider Electric. The CST activity
was reclassifi ed as discontinued operations in the Group
fi nancial statements from January 1 to September 30, 2014 (for
EUR24million net income). From October1, 2014 and for full year
2015, the 30% CST share is accounted for by the equity method.
2.2 – Acquisitions and divestments occurred
during the year
On December11, 2015, Schneider Electric announced that it has
obtained all required regulatory approvals and subsequently fi nalized
the sale of Juno Lighting, LLC («Juno») to Acuity Brands,Inc. for
a consideration of approximately USD385million (EUR343million).
The transaction generated a capital loss of EUR163million .
On December 14, 2015 – Schneider Electric announced that it
has signed an agreement to sell its Transportation Business, to
Kapsch Traffi cCom AG. The Transportation business generated
revenues of EUR134million in 2014 and is currently consolidated
under the Infrastructure business of Schneider Electric. The terms
of the agreement refl ect a sale price of about EUR35million on a
cash-free, debt-free basis. The agreement is conditioned upon the
satisfaction of certain regulatory conditions and on other customary
closing conditions. The transaction is expected to close in the
coming months. The transaction would generate an impairment of
EUR100million that has been recognized at December31, 2015 as
Other operating expense.
No signifi cant acquisitions occurred during 2015.
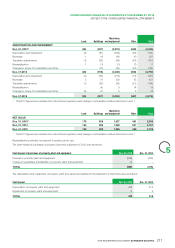
The effect of acquisitions and divestments during the year is a net cash infl ow amounting to EUR232million in 2015:
Dec.31, 2015 Dec.31, 2014
Acquisitions (162) (2,490)
Cash and cash equivalents paid* (170) (3,093)
Cash and cash equivalents acquired/(paid) 8 603
Disposals 394 -
Net fi nancial investment 232 (2,490)
* Net of the cash received from the disposal of Appliance, in 2014.
The cash infl ow from disposals is mainly related to the price received for the Juno divestment.
Note3
Segment information
The Group is organized in four businesses: Buildings & Partner,
Infrastructure, Industry and IT:
•Buildings & Partner provide low voltage power and building
automation products and solutions that address the needs of
all end markets from buildings to industries and infrastructure to
data centers to help customers improve the energy effi ciency of
the buildings;
•Infrastructure, combines all Medium Voltage activities; the
business is in charge of the end-customer segments Oil and Gas,
Electric Utilities and Transportation when it relates to solutions
integrating the offers of several activities from the Group;
•Industry, which includes Automation & Control and four end-
customer segments: OEMs, Water, Mining Minerals & Metals
and Food& Beverages when it relates to solutions integrating the
offers of several activities from the Group;
•IT, which covers Critical Power& Cooling Services and three end-
customer segments (Bank& Insurance, IT industry and Cloud&
Telecom) when it relates to solutions integrating the offers of
several activities from the Group.
Expenses concerning General Management that cannot be
allocated to a particular segment are presented under«Corporate
costs».
Operating segment data is identical to that presented to the board
of directors, which has been identifi ed as the main decision-making
body for allocating resources and evaluating segment performance.
Performance assessments used by the board of directors are
notably based on Adjusted EBITA. Share-based payment is
presented under«Corporate costs». The board of directors does
not review assets and liabilities by Business.
The same accounting principles governing the consolidated
fi nancial statements apply to segment data.
Details are provided in Chapter 4 of the registration document
(Business Review).