APC 2015 Annual Report Download - page 215
Download and view the complete annual report
Please find page 215 of the 2015 APC annual report below. You can navigate through the pages in the report by either clicking on the pages listed below, or by using the keyword search tool below to find specific information within the annual report.-
 1
1 -
2
-
3
-
4
-
5
-
6
-
7
-
8
-
9
-
10
-
11
-
12
-
13
-
14
-
15
-
16
-
17
-
18
-
19
-
20
-
21
-
22
-
23
-
24
-
25
-
26
-
27
-
28
-
29
-
30
-
31
-
32
-
33
-
34
-
35
-
36
-
37
-
38
-
39
-
40
-
41
-
42
-
43
-
44
-
45
-
46
-
47
-
48
-
49
-
50
-
51
-
52
-
53
-
54
-
55
-
56
-
57
-
58
-
59
-
60
-
61
-
62
-
63
-
64
-
65
-
66
-
67
-
68
-
69
-
70
-
71
-
72
-
73
-
74
-
75
-
76
-
77
-
78
-
79
-
80
-
81
-
82
-
83
-
84
-
85
-
86
-
87
-
88
-
89
-
90
-
91
-
92
-
93
-
94
-
95
-
96
-
97
-
98
-
99
-
100
-
101
-
102
-
103
-
104
-
105
-
106
-
107
-
108
-
109
-
110
-
111
-
112
-
113
-
114
-
115
-
116
-
117
-
118
-
119
-
120
-
121
-
122
-
123
-
124
-
125
-
126
-
127
-
128
-
129
-
130
-
131
-
132
-
133
-
134
-
135
-
136
-
137
-
138
-
139
-
140
-
141
-
142
-
143
-
144
-
145
-
146
-
147
-
148
-
149
-
150
-
151
-
152
-
153
-
154
-
155
-
156
-
157
-
158
-
159
-
160
-
161
-
162
-
163
-
164
-
165
-
166
-
167
-
168
-
169
-
170
-
171
-
172
-
173
-
174
-
175
-
176
-
177
-
178
-
179
-
180
-
181
-
182
-
183
-
184
-
185
-
186
-
187
-
188
-
189
-
190
-
191
-
192
-
193
-
194
-
195
-
196
-
197
-
198
-
199
-
200
-
201
-
202
-
203
-
204
-
 205
205 -
 206
206 -
 207
207 -
 208
208 -
 209
209 -
 210
210 -
 211
211 -
 212
212 -
 213
213 -
 214
214 -
 215
215 -
 216
216 -
 217
217 -
 218
218 -
 219
219 -
 220
220 -
 221
221 -
 222
222 -
 223
223 -
 224
224 -
 225
225 -
226
-
227
-
228
-
229
-
230
-
231
-
232
-
233
-
234
-
235
-
236
-
237
-
238
-
239
-
240
-
241
-
242
-
243
-
244
-
245
-
246
-
247
-
248
-
249
-
250
-
251
-
252
-
253
-
254
-
255
-
256
-
257
-
258
-
259
-
260
-
261
-
262
-
263
-
264
-
265
-
266
-
267
-
268
-
269
-
270
-
271
-
272
-
273
-
274
-
275
-
276
-
277
-
278
-
279
-
280
-
281
-
282
-
283
-
284
-
285
-
286
-
287
-
288
-
289
-
290
-
291
-
292
-
293
-
294
-
295
-
296
-
297
-
298
-
299
-
300
-
301
-
302
-
303
-
304
-
305
-
306
-
307
-
308
-
309
-
310
-
311
-
312
-
313
-
314
-
315
-
316
-
317
-
318
-
319
-
320
-
321
-
322
-
323
-
324
-
325
-
326
-
327
-
328
-
329
-
330
-
331
-
332
 |
 |

2015 REGISTRATION DOCUMENT SCHNEIDER ELECTRIC 213
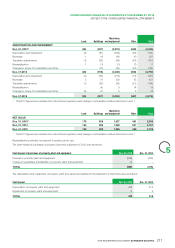
CONSOLIDATED FINANCIAL STATEMENTS AT DECEMBER31,2015
5
NOTES TO THE CONSOLIDATED FINANCIAL STATEMENTS
Note14
Investments in associates
Investments in associates can be analyzed as follows:
% Interest Share in net assets Net income/(Loss)
Dec.31, 2015 Dec.31, 2014 Dec.31, 2015 Dec.31, 2014 Dec.31, 2015 Dec.31, 2014
Fuji Electric FA Components& Systems 36.8% 36.8% 108 91 11 11
Sunten Electric Equipment 40.0% 40.0% 98 88 7 6
Custom Sensors& Technologies Topco Limited 30.0% 30.0% 93 81 93 (3)
Telvent DMS, LLC power enginering 57.0% 57.0% 34 32 (5) (2)
Delta Dore Finance 20.0% 20.0% 17 16 1 1
Others N/A N/A 14 10 2 1
TOTAL - - 364 318 109 14
Note15
Financial assets
15.1 – Available-for-sale financial assets
Available-for-sale fi nancial assets, primarily comprising investments, are detailed below:
% interest
Dec.31, 2015 Dec.31, 2014
Gross value Revaluation/
impairment Fair value Fair value
I– Listed available-for-sale fi nancial assets
NVC Lighting 9.2% 137 (104) 33 54
Gold Peak Industries Holding Ltd 4.4% 6 (3) 3 3
Total listed AFS 143 (107) 36 57
II– Unlisted available-for-sale fi nancial assets
FCPRSEV1 99. 5 %10102044
Gunsan Elektrik.(1) 100%---112
InStep Software.(1) 100%---41
SE Buildings Energy Effi ciency(2) 100%---18
FCPR Aster II (part A, B and C) 38. 3 % 22 (5) 17 14
FCPR Growth 100 % 29 - 29 10
FCPR SESS and Livelihoods 81. 7 % 13 - 13 12
Raise Fundation 5% 9 - 9 5
Others 20 (16) 4 20
Total unlisted AFS 103 (11) 92 276
TOTAL AVAILABLE FOR SALE FINANCIAL ASSETS 246 (118) 128 333
(1) Companies purchased in2014 and consolidated in 2015.
(2) Sold in2015.