APC 2015 Annual Report Download - page 211
Download and view the complete annual report
Please find page 211 of the 2015 APC annual report below. You can navigate through the pages in the report by either clicking on the pages listed below, or by using the keyword search tool below to find specific information within the annual report.-
 1
1 -
2
-
3
-
4
-
5
-
6
-
7
-
8
-
9
-
10
-
11
-
12
-
13
-
14
-
15
-
16
-
17
-
18
-
19
-
20
-
21
-
22
-
23
-
24
-
25
-
26
-
27
-
28
-
29
-
30
-
31
-
32
-
33
-
34
-
35
-
36
-
37
-
38
-
39
-
40
-
41
-
42
-
43
-
44
-
45
-
46
-
47
-
48
-
49
-
50
-
51
-
52
-
53
-
54
-
55
-
56
-
57
-
58
-
59
-
60
-
61
-
62
-
63
-
64
-
65
-
66
-
67
-
68
-
69
-
70
-
71
-
72
-
73
-
74
-
75
-
76
-
77
-
78
-
79
-
80
-
81
-
82
-
83
-
84
-
85
-
86
-
87
-
88
-
89
-
90
-
91
-
92
-
93
-
94
-
95
-
96
-
97
-
98
-
99
-
100
-
101
-
102
-
103
-
104
-
105
-
106
-
107
-
108
-
109
-
110
-
111
-
112
-
113
-
114
-
115
-
116
-
117
-
118
-
119
-
120
-
121
-
122
-
123
-
124
-
125
-
126
-
127
-
128
-
129
-
130
-
131
-
132
-
133
-
134
-
135
-
136
-
137
-
138
-
139
-
140
-
141
-
142
-
143
-
144
-
145
-
146
-
147
-
148
-
149
-
150
-
151
-
152
-
153
-
154
-
155
-
156
-
157
-
158
-
159
-
160
-
161
-
162
-
163
-
164
-
165
-
166
-
167
-
168
-
169
-
170
-
171
-
172
-
173
-
174
-
175
-
176
-
177
-
178
-
179
-
180
-
181
-
182
-
183
-
184
-
185
-
186
-
187
-
188
-
189
-
190
-
191
-
192
-
193
-
194
-
195
-
196
-
197
-
198
-
199
-
200
-
 201
201 -
 202
202 -
 203
203 -
 204
204 -
 205
205 -
 206
206 -
 207
207 -
 208
208 -
 209
209 -
 210
210 -
 211
211 -
 212
212 -
 213
213 -
 214
214 -
 215
215 -
 216
216 -
 217
217 -
 218
218 -
 219
219 -
 220
220 -
 221
221 -
222
-
223
-
224
-
225
-
226
-
227
-
228
-
229
-
230
-
231
-
232
-
233
-
234
-
235
-
236
-
237
-
238
-
239
-
240
-
241
-
242
-
243
-
244
-
245
-
246
-
247
-
248
-
249
-
250
-
251
-
252
-
253
-
254
-
255
-
256
-
257
-
258
-
259
-
260
-
261
-
262
-
263
-
264
-
265
-
266
-
267
-
268
-
269
-
270
-
271
-
272
-
273
-
274
-
275
-
276
-
277
-
278
-
279
-
280
-
281
-
282
-
283
-
284
-
285
-
286
-
287
-
288
-
289
-
290
-
291
-
292
-
293
-
294
-
295
-
296
-
297
-
298
-
299
-
300
-
301
-
302
-
303
-
304
-
305
-
306
-
307
-
308
-
309
-
310
-
311
-
312
-
313
-
314
-
315
-
316
-
317
-
318
-
319
-
320
-
321
-
322
-
323
-
324
-
325
-
326
-
327
-
328
-
329
-
330
-
331
-
332
 |
 |

2015 REGISTRATION DOCUMENT SCHNEIDER ELECTRIC 209
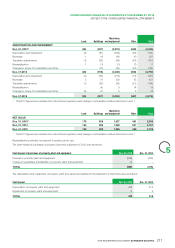
CONSOLIDATED FINANCIAL STATEMENTS AT DECEMBER31,2015
5
NOTES TO THE CONSOLIDATED FINANCIAL STATEMENTS
Trademarks Software Development
projects (R&D) Other Total
AMORTIZATION AND
IMPAIRMENT
Dec.31, 2013* (360) (655) (710) (1,021) (2,746)
Depreciation and impairment (65) (52) (180) (189) (486)
Reversals 4 14 2 (14) 6
Translation adjustments - (16) (22) (84) (122)
Reclassifi cation - 2 (6) (2) (6)
Changes in scope of consolidation
and other 23 1 6 88 118
Dec.31, 2014 (398) (706) (910) (1,222) (3,236)
Depreciation and impairment (355) (55) (339) (210) (959)
Recapture 3 46 9 (1) 57
Translation adjustments (12) ( 15 ) (34) (86) (147)
Reclassifi cation (3) - 48 (11) 34
Changes in scope of consolidation
and other - 2 - 45 47
Dec. 31, 2015 (765) (728) (1,226) (1,485) (4,204)
* The 2013 fi gures were restated from discontinued operations and change in consolidation method disclosed in note1.
Trademarks Software Development
projects (R&D) Other Total
NET VALUE
Dec.31, 2013* 2,246 168 1,053 813 4,280
Dec.31, 2014 2,460 163 1,239 1,198 5,061
Dec .31, 2015 2,241 151 1,252 1,082 4,726
* The 2013 fi gures were restated from discontinued operations and change in consolidation method disclosed in note1.
In 2015, change in Intangible assets mainly related to R&D
capitalized development costs for EUR373 million. The decrease
in the intangible assets is mainly due to the disposal of Juno (see
note2.2).
In 2014, change in Intangible assets mainly related to changes in
scope of other intangibles assets including recognized intangibles
relating to Invensys acquisition for EUR521 million and to R&D
capitalized development costs for EUR355million.
The amortization and impairment of intangible assets other than goodwill restated at statutory cash fl ow were as follows:
Cash impact Dec.31, 2015 Dec.31, 2014
Amortization of intangible assets other than goodwill 551 483
Impairment on intangible assets other than goodwill and others 408 3
TOTAL* 959 486
* Includes amortization& impairment of intangibles assets from purchase price allocation for EUR277million for the year 2015 and
EUR259million for the year 2014 (disclosed in note8).