APC 2015 Annual Report Download - page 9
Download and view the complete annual report
Please find page 9 of the 2015 APC annual report below. You can navigate through the pages in the report by either clicking on the pages listed below, or by using the keyword search tool below to find specific information within the annual report.-
 1
1 -
 2
2 -
 3
3 -
 4
4 -
 5
5 -
 6
6 -
 7
7 -
 8
8 -
 9
9 -
 10
10 -
 11
11 -
 12
12 -
 13
13 -
 14
14 -
 15
15 -
 16
16 -
 17
17 -
 18
18 -
 19
19 -
 20
20 -
21
-
22
-
23
-
24
-
25
-
26
-
27
-
28
-
29
-
30
-
31
-
32
-
33
-
34
-
35
-
36
-
37
-
38
-
39
-
40
-
41
-
42
-
43
-
44
-
45
-
46
-
47
-
48
-
49
-
50
-
51
-
52
-
53
-
54
-
55
-
56
-
57
-
58
-
59
-
60
-
61
-
62
-
63
-
64
-
65
-
66
-
67
-
68
-
69
-
70
-
71
-
72
-
73
-
74
-
75
-
76
-
77
-
78
-
79
-
80
-
81
-
82
-
83
-
84
-
85
-
86
-
87
-
88
-
89
-
90
-
91
-
92
-
93
-
94
-
95
-
96
-
97
-
98
-
99
-
100
-
101
-
102
-
103
-
104
-
105
-
106
-
107
-
108
-
109
-
110
-
111
-
112
-
113
-
114
-
115
-
116
-
117
-
118
-
119
-
120
-
121
-
122
-
123
-
124
-
125
-
126
-
127
-
128
-
129
-
130
-
131
-
132
-
133
-
134
-
135
-
136
-
137
-
138
-
139
-
140
-
141
-
142
-
143
-
144
-
145
-
146
-
147
-
148
-
149
-
150
-
151
-
152
-
153
-
154
-
155
-
156
-
157
-
158
-
159
-
160
-
161
-
162
-
163
-
164
-
165
-
166
-
167
-
168
-
169
-
170
-
171
-
172
-
173
-
174
-
175
-
176
-
177
-
178
-
179
-
180
-
181
-
182
-
183
-
184
-
185
-
186
-
187
-
188
-
189
-
190
-
191
-
192
-
193
-
194
-
195
-
196
-
197
-
198
-
199
-
200
-
201
-
202
-
203
-
204
-
205
-
206
-
207
-
208
-
209
-
210
-
211
-
212
-
213
-
214
-
215
-
216
-
217
-
218
-
219
-
220
-
221
-
222
-
223
-
224
-
225
-
226
-
227
-
228
-
229
-
230
-
231
-
232
-
233
-
234
-
235
-
236
-
237
-
238
-
239
-
240
-
241
-
242
-
243
-
244
-
245
-
246
-
247
-
248
-
249
-
250
-
251
-
252
-
253
-
254
-
255
-
256
-
257
-
258
-
259
-
260
-
261
-
262
-
263
-
264
-
265
-
266
-
267
-
268
-
269
-
270
-
271
-
272
-
273
-
274
-
275
-
276
-
277
-
278
-
279
-
280
-
281
-
282
-
283
-
284
-
285
-
286
-
287
-
288
-
289
-
290
-
291
-
292
-
293
-
294
-
295
-
296
-
297
-
298
-
299
-
300
-
301
-
302
-
303
-
304
-
305
-
306
-
307
-
308
-
309
-
310
-
311
-
312
-
313
-
314
-
315
-
316
-
317
-
318
-
319
-
320
-
321
-
322
-
323
-
324
-
325
-
326
-
327
-
328
-
329
-
330
-
331
-
332
 |
 |

2015 REGISTRATION DOCUMENT SCHNEIDER ELECTRIC 7
KEY FIGURES 2015
>
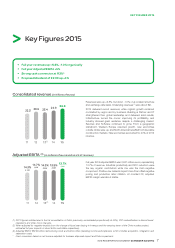
Key Figures 2015
•Full year revenues up +6.8%, -1.0% organically
•Full year Adjusted EBITA +5%
•Strong cash conversion at 113%*
•Proposed dividend of ¤2.00 up +4%
Consolidated revenue (in billions of euros)
1211 13(1) 14 15
22.3 23.9 23.4 24.9 26.6
Revenues were up +6.8%, but down -1.0% on a constant structure
and exchange rate basis. Underlying revenues(2) were about fl at.
2015 delivered record revenues, while organic growth remained
contrasted by region and by business. Building & Partner and IT
strengthened their global leadership and delivered solid results,
Infrastructure turned the corner improving its profi tability, and
Industry showed great resilience despite a challenging market.
Services and Software continued to grow. From a geographic
standpoint, Western Europe resumed growth, new economies
outside China were up, and North America benefi ted from favorable
construction markets. New economies accounted for 43% of 2015
revenue.
Adjusted EBITA (3 ) (in millions of euros and as a % of revenue)
(1) 2013 fi gures restated due to the full consolidation of Delixi (previously consolidated proportionally at 50%), CST reclassifi cation in discontinued
operations and other minor changes.
(2) When adjusted for negative impacts from the change of fi scal year closing in Invensys and the ramping down of the China nuclear project,
estimated full year impacts of about €40m and €66m respectively.
(3) Adjusted EBITA: EBITA before restructuring costs and before other operating income and expenses, which includes acquisition, integration and
separation costs.
* Cash conversion based on net income adjusted for business disposals impact and Pelco impairment .
1211
14.3%
3 ,190
13(1)
14.7%
3,515
14 15
14.3%
3,356
13.9%
3,463
13.7%
3,641
Full year 2015 adjusted EBITA was 3,641 million euros, representing
13.7% of revenue. Industrial productivity and SFC reduction were
the key organic contributors while mix was the main negative
component. Positive raw material impact more than offset negative
pricing and production labor infl ation . At constant FX, adjusted
EBITA margin was about stable.