APC 2015 Annual Report Download - page 210
Download and view the complete annual report
Please find page 210 of the 2015 APC annual report below. You can navigate through the pages in the report by either clicking on the pages listed below, or by using the keyword search tool below to find specific information within the annual report.-
 1
1 -
2
-
3
-
4
-
5
-
6
-
7
-
8
-
9
-
10
-
11
-
12
-
13
-
14
-
15
-
16
-
17
-
18
-
19
-
20
-
21
-
22
-
23
-
24
-
25
-
26
-
27
-
28
-
29
-
30
-
31
-
32
-
33
-
34
-
35
-
36
-
37
-
38
-
39
-
40
-
41
-
42
-
43
-
44
-
45
-
46
-
47
-
48
-
49
-
50
-
51
-
52
-
53
-
54
-
55
-
56
-
57
-
58
-
59
-
60
-
61
-
62
-
63
-
64
-
65
-
66
-
67
-
68
-
69
-
70
-
71
-
72
-
73
-
74
-
75
-
76
-
77
-
78
-
79
-
80
-
81
-
82
-
83
-
84
-
85
-
86
-
87
-
88
-
89
-
90
-
91
-
92
-
93
-
94
-
95
-
96
-
97
-
98
-
99
-
100
-
101
-
102
-
103
-
104
-
105
-
106
-
107
-
108
-
109
-
110
-
111
-
112
-
113
-
114
-
115
-
116
-
117
-
118
-
119
-
120
-
121
-
122
-
123
-
124
-
125
-
126
-
127
-
128
-
129
-
130
-
131
-
132
-
133
-
134
-
135
-
136
-
137
-
138
-
139
-
140
-
141
-
142
-
143
-
144
-
145
-
146
-
147
-
148
-
149
-
150
-
151
-
152
-
153
-
154
-
155
-
156
-
157
-
158
-
159
-
160
-
161
-
162
-
163
-
164
-
165
-
166
-
167
-
168
-
169
-
170
-
171
-
172
-
173
-
174
-
175
-
176
-
177
-
178
-
179
-
180
-
181
-
182
-
183
-
184
-
185
-
186
-
187
-
188
-
189
-
190
-
191
-
192
-
193
-
194
-
195
-
196
-
197
-
198
-
199
-
 200
200 -
 201
201 -
 202
202 -
 203
203 -
 204
204 -
 205
205 -
 206
206 -
 207
207 -
 208
208 -
 209
209 -
 210
210 -
 211
211 -
 212
212 -
 213
213 -
 214
214 -
 215
215 -
 216
216 -
 217
217 -
 218
218 -
 219
219 -
 220
220 -
221
-
222
-
223
-
224
-
225
-
226
-
227
-
228
-
229
-
230
-
231
-
232
-
233
-
234
-
235
-
236
-
237
-
238
-
239
-
240
-
241
-
242
-
243
-
244
-
245
-
246
-
247
-
248
-
249
-
250
-
251
-
252
-
253
-
254
-
255
-
256
-
257
-
258
-
259
-
260
-
261
-
262
-
263
-
264
-
265
-
266
-
267
-
268
-
269
-
270
-
271
-
272
-
273
-
274
-
275
-
276
-
277
-
278
-
279
-
280
-
281
-
282
-
283
-
284
-
285
-
286
-
287
-
288
-
289
-
290
-
291
-
292
-
293
-
294
-
295
-
296
-
297
-
298
-
299
-
300
-
301
-
302
-
303
-
304
-
305
-
306
-
307
-
308
-
309
-
310
-
311
-
312
-
313
-
314
-
315
-
316
-
317
-
318
-
319
-
320
-
321
-
322
-
323
-
324
-
325
-
326
-
327
-
328
-
329
-
330
-
331
-
332
 |
 |

2015 REGISTRATION DOCUMENT SCHNEIDER ELECTRIC208
CONSOLIDATED FINANCIAL STATEMENTS AT DECEMBER31,2015
5NOTES TO THE CONSOLIDATED FINANCIAL STATEMENTS
11.2 – Movements during the year
The main movements during the year are summarized as follows:
Full year 2015 Full year 2014
Net goodwill at opening 16,733 13,048
Acquisitions 412 3,177
Disposals (277) (423)
Impairment (65) -
Translation adjustment 978 931
Reclassifi cations --
Net goodwill at year end 17,781 16,733
Included cumulative impairment (375) (280)
Acquisitions
Goodwill generated by acquisitions made during the year totaled
EUR412 million and corresponds mainly to the Purchase Price
Allocation of the Invensys group. Invensys goodwill has been
allocated to the Industry CGU.
Goodwill generated by acquisitions in 2014 totaled EUR3, 177million
and corresponds mainly to the Invensys group.
Impairment tests performed on all the Group’s CGUs have not led
to impairment losses being recognized.
Other changes
Translation adjustments concern principally goodwill inUSdollars.
Note12
Intangible assets
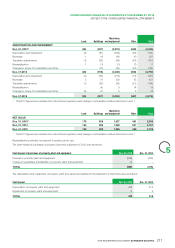
12.1 – Change in intangible assets
Trademarks Software Development
projects (R&D) Other Total
GROSS VALUE
Dec.31, 2013* 2,606 823 1,763 1,834 7,026
Acquisitions - 27 355 14 396
Disposals - (15) (3) (10) (28)
Translation adjustments 261 19 59 228 567
Reclassifi cation - 17 (17) 7 7
Changes in scope of consolidation
and other (9) (2) (7) 347 329
Dec.31, 2014 2,858 870 2,149 2,420 8,297
Acquisitions 1 21 373 1 396
Disposals (1) (51) (15) (13) (80)
Translation adjustments 249 16 73 210 548
Reclassifi cation 3 25 (102) 42 (32)
Changes in scope of consolidation
and other (104) (2) - (93) (199)
Dec. 31, 2015 3,006 879 2,478 2,567 8,930
* The 2013 fi gures were restated from discontinued operations and change in consolidation method disclosed in note1.