Cabela's 2005 Annual Report Download - page 110
Download and view the complete annual report
Please find page 110 of the 2005 Cabela's annual report below. You can navigate through the pages in the report by either clicking on the pages listed below, or by using the keyword search tool below to find specific information within the annual report.-
 1
1 -
2
-
3
-
4
-
5
-
6
-
7
-
8
-
9
-
10
-
11
-
12
-
13
-
14
-
15
-
16
-
17
-
18
-
19
-
20
-
21
-
22
-
23
-
24
-
25
-
26
-
27
-
28
-
29
-
30
-
31
-
32
-
33
-
34
-
35
-
36
-
37
-
38
-
39
-
40
-
41
-
42
-
43
-
44
-
45
-
46
-
47
-
48
-
49
-
50
-
51
-
52
-
53
-
54
-
55
-
56
-
57
-
58
-
59
-
60
-
61
-
62
-
63
-
64
-
65
-
66
-
67
-
68
-
69
-
70
-
71
-
72
-
73
-
74
-
75
-
76
-
77
-
78
-
79
-
80
-
81
-
82
-
83
-
84
-
85
-
86
-
87
-
88
-
89
-
90
-
91
-
92
-
93
-
94
-
95
-
96
-
97
-
98
-
99
-
 100
100 -
 101
101 -
 102
102 -
 103
103 -
 104
104 -
 105
105 -
 106
106 -
 107
107 -
 108
108 -
 109
109 -
 110
110 -
 111
111 -
 112
112 -
 113
113 -
 114
114 -
 115
115 -
 116
116 -
 117
117 -
 118
118 -
 119
119 -
 120
120 -
121
-
122
-
123
-
124
-
125
-
126
 |
 |

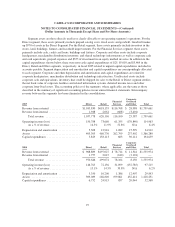
CABELA’S INCORPORATED AND SUBSIDIARIES
NOTES TO CONSOLIDATED FINANCIAL STATEMENTS—(Continued)
(Dollar Amounts in Thousands Except Share and Per Share Amounts)
2003 Direct Retail
Financial
Services
Corporate
Overhead
and Other Total
Revenue from external ....................... $923,195 $405,308 $ 57,531 $ 6,389 $1,392,423
Revenue from internal ....................... 1,101 1,930 747 (3,778) —
Total revenue .......................... 924,296 407,238 58,278 2,611 1,392,423
Operating income (loss) ...................... 143,996 56,193 19,271 (134,529) 84,931
As a % of revenue ...................... 15.6% 13.8% 33.1% N/A 6.1%
Depreciation and amortization ................. 5,141 8,846 1,318 11,410 26,715
Assets .................................... 235,382 245,301 171,560 311,310 963,553
Capital expenditures ......................... 3,786 50,036 752 18,398 72,972
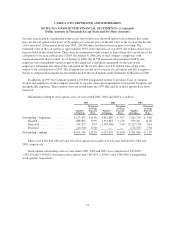
The components and amounts of net revenue for our Financial Services business for 2005, 2004 and 2003
were as follows:
2005 2004 2003
INTEREST AND FEE INCOME ......................... $ 17,196 $ 12,735 $ 7,858
INTEREST EXPENSE ................................. (3,241) (3,063) (3,226)
NET INTEREST INCOME ............................. 13,955 9,672 4,632
NON-INTEREST INCOME:
Securitization income .............................. 133,032 96,466 74,472
Other non-interest income .......................... 31,836 24,905 19,050
Total non-interest income ....................... 164,868 121,371 93,522
Less: Customer rewards costs ........................ (62,723) (52,939) (39,876)
FINANCIAL SERVICES REVENUE ..................... $116,100 $ 78,104 $ 58,278
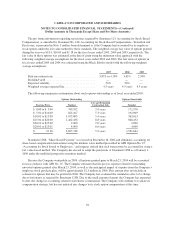
The Company’s products are principally marketed to individuals within the United States. Net sales realized
from other geographic markets, primarily Canada, have collectively been less than 1% of consolidated net
merchandise sales in each reported period. No single customer accounted for ten percent or more of consolidated
net sales. No single product or service accounts for a significant percentage of the Company’s consolidated
revenue.
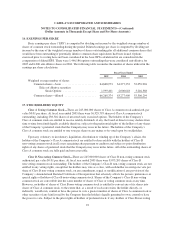
21. SUBSEQUENT EVENTS
On February 27, 2006 the Company issued $215,000 in unsecured notes with principal payable in full in ten
years and interest payments made semiannually at a rate of 5.99%. A closing fee of $365 was paid at closing.
98