Cabela's 2005 Annual Report Download - page 50
Download and view the complete annual report
Please find page 50 of the 2005 Cabela's annual report below. You can navigate through the pages in the report by either clicking on the pages listed below, or by using the keyword search tool below to find specific information within the annual report.-
 1
1 -
2
-
3
-
4
-
5
-
6
-
7
-
8
-
9
-
10
-
11
-
12
-
13
-
14
-
15
-
16
-
17
-
18
-
19
-
20
-
21
-
22
-
23
-
24
-
25
-
26
-
27
-
28
-
29
-
30
-
31
-
32
-
33
-
34
-
35
-
36
-
37
-
38
-
39
-
 40
40 -
 41
41 -
 42
42 -
 43
43 -
 44
44 -
 45
45 -
 46
46 -
 47
47 -
 48
48 -
 49
49 -
 50
50 -
 51
51 -
 52
52 -
 53
53 -
 54
54 -
 55
55 -
 56
56 -
 57
57 -
 58
58 -
 59
59 -
 60
60 -
61
-
62
-
63
-
64
-
65
-
66
-
67
-
68
-
69
-
70
-
71
-
72
-
73
-
74
-
75
-
76
-
77
-
78
-
79
-
80
-
81
-
82
-
83
-
84
-
85
-
86
-
87
-
88
-
89
-
90
-
91
-
92
-
93
-
94
-
95
-
96
-
97
-
98
-
99
-
100
-
101
-
102
-
103
-
104
-
105
-
106
-
107
-
108
-
109
-
110
-
111
-
112
-
113
-
114
-
115
-
116
-
117
-
118
-
119
-
120
-
121
-
122
-
123
-
124
-
125
-
126
 |
 |

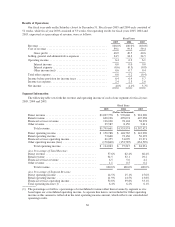
Managed Financial Services Revenue:
Fiscal Year
2005 2004 2003
(Dollars in thousands)
Interest income ................................................ $ 102,824 $ 71,309 $ 54,412
Interchange income, net of customer reward costs ..................... 52,737 36,493 28,945
Other fee income ............................................... 20,738 16,841 13,605
Interest expense ................................................ (41,654) (26,750) (21,361)
Provision for loan losses ......................................... (24,254) (20,208) (17,380)
Other ........................................................ 5,709 419 57
Managed Financial Services revenue ............................... $ 116,100 $ 78,104 $ 58,278
As a Percentage of Managed Credit Card Loans
Managed Financial Services Revenue:
Interest income ................................................ 9.4% 8.0% 7.7%
Interchange income, net of customer reward costs ..................... 4.8 4.1 4.1
Other fee income ............................................... 1.9 1.9 1.9
Interest expense ................................................ (3.8) (3.0) (3.0)
Provision for loan losses ......................................... (2.2) (2.3) (2.4)
Other ........................................................ 0.5 0.0 0.0
Managed Financial Services revenue ............................... 10.6% 8.7% 8.3%
Average reported credit card loans ................................. $ 106,115 $ 82,526 $ 61,850
Average managed credit card loans ................................ $1,095,580 $888,730 $705,265
Fiscal Year 2005 Compared to Fiscal Year 2004
Revenue
Revenue increased by $243.7 million, or 15.7%, to $1,799.7 million in fiscal 2005 from $1,556.0 million in
fiscal 2004 as we experienced revenue growth in each of our segments. We sold a significant amount of land in
fiscal 2005 as compared to fiscal 2004, which was the primary contributor to the revenue growth in our Other
segment of $17.4 million.
Direct Revenue. Direct revenue increased by $67.1million, or 6.9%, to $1,037.8 million in fiscal 2005 from
$970.6 million in fiscal 2004 primarily due to growth in sales through our website. The number of customer
packages shipped increased by 8.0% to 9.9 million in fiscal 2005. Circulation of our catalogs increased by 0.8
billion pages, or 2.3%, to 35.3 billion pages in fiscal 2005 from 34.5 billion pages in fiscal 2004. The number of
active customers, which we define as those customers who have purchased merchandise from us in the last
twelve months, increased by 4.8% to approximately 4.4 million in fiscal 2005 over fiscal 2004. The product
categories that contributed the largest dollar volume increase to our fiscal 2005 Direct revenue growth included
hunting equipment, footwear and camping.
Retail Revenue. Retail revenue increased by $121.1 million, or 24.3%, to $620.2 million in fiscal 2005 from
$499.1 million in fiscal 2004 due to increased new store sales of $154.9 million. Revenue for stores in our
comparable base decreased by $29.4 million, or 6.3%, compared to fiscal 2004. We attribute the decrease in
comparable store sales to the addition of our Hamburg, Pennsylvania store in the comparable store base, higher
gasoline prices, unemployment related to the industries near our Dundee, Michigan store and cannibalization of
sales from our Owatonna, Minnesota store related to the opening of our Rogers, Minnesota store. Our Hamburg
store was very successful in 2004 making comparable store sales challenging. Hurricanes in the southern part of
38