Cabela's 2005 Annual Report Download - page 77
Download and view the complete annual report
Please find page 77 of the 2005 Cabela's annual report below. You can navigate through the pages in the report by either clicking on the pages listed below, or by using the keyword search tool below to find specific information within the annual report.-
 1
1 -
2
-
3
-
4
-
5
-
6
-
7
-
8
-
9
-
10
-
11
-
12
-
13
-
14
-
15
-
16
-
17
-
18
-
19
-
20
-
21
-
22
-
23
-
24
-
25
-
26
-
27
-
28
-
29
-
30
-
31
-
32
-
33
-
34
-
35
-
36
-
37
-
38
-
39
-
40
-
41
-
42
-
43
-
44
-
45
-
46
-
47
-
48
-
49
-
50
-
51
-
52
-
53
-
54
-
55
-
56
-
57
-
58
-
59
-
60
-
61
-
62
-
63
-
64
-
65
-
66
-
 67
67 -
 68
68 -
 69
69 -
 70
70 -
 71
71 -
 72
72 -
 73
73 -
 74
74 -
 75
75 -
 76
76 -
 77
77 -
 78
78 -
 79
79 -
 80
80 -
 81
81 -
 82
82 -
 83
83 -
 84
84 -
 85
85 -
 86
86 -
 87
87 -
88
-
89
-
90
-
91
-
92
-
93
-
94
-
95
-
96
-
97
-
98
-
99
-
100
-
101
-
102
-
103
-
104
-
105
-
106
-
107
-
108
-
109
-
110
-
111
-
112
-
113
-
114
-
115
-
116
-
117
-
118
-
119
-
120
-
121
-
122
-
123
-
124
-
125
-
126
 |
 |

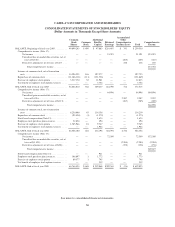
CABELA’S INCORPORATED AND SUBSIDIARIES
CONSOLIDATED STATEMENTS OF INCOME
(Dollar Amounts in Thousands Except Per Share and Share Amounts)
2005 2004 2003
REVENUE:
Merchandise sales ...................................... $ 1,657,974 $ 1,469,720 $ 1,331,534
Financial services revenue ............................... 116,100 78,104 58,278
Other revenue ......................................... 25,587 8,150 2,611
Total revenue ...................................... 1,799,661 1,555,974 1,392,423
COST OF REVENUE:
Cost of merchandise sales ................................ 1,044,028 918,206 826,869
Cost of other revenue ................................... 20,294 7,459 659
Total cost of revenue (exclusive of depreciation and
amortization) .................................... 1,064,322 925,665 827,528
GROSS PROFIT ......................................... 735,339 630,309 564,895
SELLING, GENERAL AND ADMINISTRATIVE EXPENSES . . . 620,376 533,094 479,964
OPERATING INCOME ................................... 114,963 97,215 84,931
OTHER INCOME (EXPENSE):
Interest income ........................................ 672 601 408
Interest expense ........................................ (10,928) (8,178) (11,158)
Other income, net (Note 9) ............................... 10,663 10,443 5,612
407 2,866 (5,138)
INCOME BEFORE PROVISION FOR INCOME TAXES ........ 115,370 100,081 79,793
INCOME TAX EXPENSE (Note 10) ......................... 42,801 35,085 28,402
NET INCOME .......................................... $ 72,569 $ 64,996 $ 51,391
EARNINGS PER SHARE (Note 16):
Basic ................................................ $ 1.12 $ 1.06 $ 0.99
Diluted ............................................... $ 1.10 $ 1.03 $ 0.93
WEIGHTED AVERAGE SHARES OUTSTANDING (Note 16):
Basic ................................................ 64,668,973 61,277,352 52,059,926
Diluted ............................................... 66,268,374 63,277,400 55,306,294
See notes to consolidated financial statements.
65