Cabela's 2005 Annual Report Download - page 44
Download and view the complete annual report
Please find page 44 of the 2005 Cabela's annual report below. You can navigate through the pages in the report by either clicking on the pages listed below, or by using the keyword search tool below to find specific information within the annual report.-
 1
1 -
2
-
3
-
4
-
5
-
6
-
7
-
8
-
9
-
10
-
11
-
12
-
13
-
14
-
15
-
16
-
17
-
18
-
19
-
20
-
21
-
22
-
23
-
24
-
25
-
26
-
27
-
28
-
29
-
30
-
31
-
32
-
33
-
 34
34 -
 35
35 -
 36
36 -
 37
37 -
 38
38 -
 39
39 -
 40
40 -
 41
41 -
 42
42 -
 43
43 -
 44
44 -
 45
45 -
 46
46 -
 47
47 -
 48
48 -
 49
49 -
 50
50 -
 51
51 -
 52
52 -
 53
53 -
 54
54 -
55
-
56
-
57
-
58
-
59
-
60
-
61
-
62
-
63
-
64
-
65
-
66
-
67
-
68
-
69
-
70
-
71
-
72
-
73
-
74
-
75
-
76
-
77
-
78
-
79
-
80
-
81
-
82
-
83
-
84
-
85
-
86
-
87
-
88
-
89
-
90
-
91
-
92
-
93
-
94
-
95
-
96
-
97
-
98
-
99
-
100
-
101
-
102
-
103
-
104
-
105
-
106
-
107
-
108
-
109
-
110
-
111
-
112
-
113
-
114
-
115
-
116
-
117
-
118
-
119
-
120
-
121
-
122
-
123
-
124
-
125
-
126
 |
 |
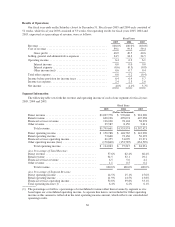
Gross Profit
We define gross profit as the difference between revenue and cost of revenue. As we discuss below, we
believe that operating income presents a more meaningful measure of our consolidated operating performance
than gross profit because of the following factors:
• our Financial Services segment does not have costs classified as cost of revenue which results in a
disproportionate gross profit contribution for this segment;
• we do not include occupancy costs, depreciation, direct labor or warehousing costs in cost of revenue,
which affects comparability to other retailers who may account differently for some or all of these costs;
and
• we have historically attempted to price our customer shipping charges to generally match our shipping
expenses, which reduces gross profit as a percentage of Direct revenue.
Selling, General and Administrative Expenses
Selling, general and administrative expenses include directly identifiable operating costs and other expenses,
as well as depreciation and amortization. For our Direct segment, these operating costs primarily consist of
catalog development, production and circulation costs, Internet advertising costs and order processing costs. For
our Retail segment, these costs primarily consist of payroll, store occupancy, utilities and advertising costs. For
our Financial Services segment, these costs primarily consist of advertising costs, third party data processing
costs associated with servicing accounts, payroll and other administrative fees. Our Other expenses include
shared-service costs, general and administrative expenses and the costs of operating our various other small
businesses described above which are not included in any of our segments. Shared-service costs include costs for
services shared by two or more of our business segments (principally our Direct and Retail segments) and
include receiving, distribution and storage costs, merchandising, quality assurance costs and corporate occupancy
costs. General and administrative expenses include costs associated with general corporate management and
shared departmental services such as management information systems, finance, human resources and legal.
Operating Income
Operating income is defined as revenue less cost of revenue and selling, general and administrative
expenses. Given the variety of segments we report and the different cost classifications inherent in each of their
respective businesses, it is difficult to compare our consolidated results on the basis of gross profit.
Consequently, we believe that operating income is the best metric to compare the performance and profitability
of our segments to each other and to judge our consolidated performance because it includes all applicable
revenue and cost items.
Trends and Opportunities
Retail Expansion. Our new destination retail store expansion plans will require significant capital
expenditures and effort. We anticipate the average initial investment to construct a large-format destination retail
store will range from approximately $30 million to $50 million depending on the size of the store and the amount
of public improvements necessary. This investment includes the cost of real estate, site work, public
improvements such as utilities and roads, buildings, equipment, fixtures (including taxidermy) and inventory. See
“—Liquidity and Capital Resources—Retail Store Expansion.” We currently intend to open five new large-
format destination retail stores in 2006. Where appropriate, we intend to continue to utilize economic
development arrangements with state and local governments to offset some of these costs and improve the return
on investment on new destination retail stores. Our failure to obtain or negotiate economic development packages
with local and state governments could cause us to significantly alter our destination retail store strategy or
format and/or delay the construction of one or more of our destination retail stores and could adversely affect our
revenue, cash flows and profitability. We added 59.3% more retail square footage in 2005, and we anticipate that
the five large-format destination retail stores we currently plan to open in 2006 will add approximately 707,500,
or 33.7%, to our retail square footage in 2006.
32