Cabela's 2005 Annual Report Download - page 93
Download and view the complete annual report
Please find page 93 of the 2005 Cabela's annual report below. You can navigate through the pages in the report by either clicking on the pages listed below, or by using the keyword search tool below to find specific information within the annual report.-
 1
1 -
2
-
3
-
4
-
5
-
6
-
7
-
8
-
9
-
10
-
11
-
12
-
13
-
14
-
15
-
16
-
17
-
18
-
19
-
20
-
21
-
22
-
23
-
24
-
25
-
26
-
27
-
28
-
29
-
30
-
31
-
32
-
33
-
34
-
35
-
36
-
37
-
38
-
39
-
40
-
41
-
42
-
43
-
44
-
45
-
46
-
47
-
48
-
49
-
50
-
51
-
52
-
53
-
54
-
55
-
56
-
57
-
58
-
59
-
60
-
61
-
62
-
63
-
64
-
65
-
66
-
67
-
68
-
69
-
70
-
71
-
72
-
73
-
74
-
75
-
76
-
77
-
78
-
79
-
80
-
81
-
82
-
 83
83 -
 84
84 -
 85
85 -
 86
86 -
 87
87 -
 88
88 -
 89
89 -
 90
90 -
 91
91 -
 92
92 -
 93
93 -
 94
94 -
 95
95 -
 96
96 -
 97
97 -
 98
98 -
 99
99 -
 100
100 -
 101
101 -
 102
102 -
 103
103 -
104
-
105
-
106
-
107
-
108
-
109
-
110
-
111
-
112
-
113
-
114
-
115
-
116
-
117
-
118
-
119
-
120
-
121
-
122
-
123
-
124
-
125
-
126
 |
 |

CABELA’S INCORPORATED AND SUBSIDIARIES
NOTES TO CONSOLIDATED FINANCIAL STATEMENTS—(Continued)
(Dollar Amounts in Thousands Except Share and Per Share Amounts)
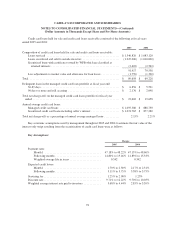
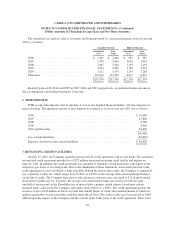
Aggregate amortization expense was $1,014, $1,458 and $1,206 for the fiscal years ended 2005, 2004 and
2003, respectively. Deferred financing costs of $25 were written off when the revolving credit facility was
amended. Estimated amortization expense for the fiscals years shown is as follows:
2006 .............................................................. $ 850
2007 .............................................................. 515
2008 .............................................................. 283
2009 .............................................................. 283
2010 .............................................................. 276
Thereafter .......................................................... 441
Total .......................................................... $2,648
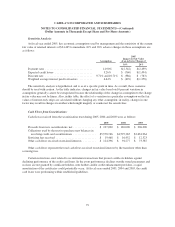
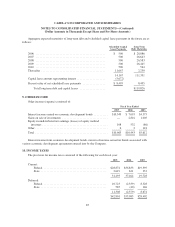
5. MARKETABLE SECURITIES
Marketable securities consisted of the following at each fiscal year:
Fiscal Year Ended 2005
Cost
Gross
Unrealized
Gains
Gross
Unrealized
Losses
Fair
Value
Available-for-sale:
Economic development bonds ............. $133,379 $ 410 $(440) $133,349
Held to maturity:
Mortgage backed securities ............... 1,285 — — 1,285
Economic development bonds ............. 11,110 — — 11,110
$145,774 $ 410 $(440) $145,744
Fiscal Year Ended 2004
Cost
Gross
Unrealized
Gains
Gross
Unrealized
Losses
Fair
Value
Available-for-sale:
Economic development bonds ............. $128,683 $3,976 $ — $132,659
Held to maturity:
Mortgage backed securities ............... 1,000 — — 1,000
Economic development bonds ............. 11,928 — — 11,928
$141,611 $3,976 $ — $145,587
81