Cabela's 2005 Annual Report Download - page 49
Download and view the complete annual report
Please find page 49 of the 2005 Cabela's annual report below. You can navigate through the pages in the report by either clicking on the pages listed below, or by using the keyword search tool below to find specific information within the annual report.-
 1
1 -
2
-
3
-
4
-
5
-
6
-
7
-
8
-
9
-
10
-
11
-
12
-
13
-
14
-
15
-
16
-
17
-
18
-
19
-
20
-
21
-
22
-
23
-
24
-
25
-
26
-
27
-
28
-
29
-
30
-
31
-
32
-
33
-
34
-
35
-
36
-
37
-
38
-
 39
39 -
 40
40 -
 41
41 -
 42
42 -
 43
43 -
 44
44 -
 45
45 -
 46
46 -
 47
47 -
 48
48 -
 49
49 -
 50
50 -
 51
51 -
 52
52 -
 53
53 -
 54
54 -
 55
55 -
 56
56 -
 57
57 -
 58
58 -
 59
59 -
60
-
61
-
62
-
63
-
64
-
65
-
66
-
67
-
68
-
69
-
70
-
71
-
72
-
73
-
74
-
75
-
76
-
77
-
78
-
79
-
80
-
81
-
82
-
83
-
84
-
85
-
86
-
87
-
88
-
89
-
90
-
91
-
92
-
93
-
94
-
95
-
96
-
97
-
98
-
99
-
100
-
101
-
102
-
103
-
104
-
105
-
106
-
107
-
108
-
109
-
110
-
111
-
112
-
113
-
114
-
115
-
116
-
117
-
118
-
119
-
120
-
121
-
122
-
123
-
124
-
125
-
126
 |
 |

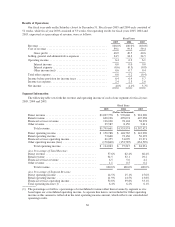
For credit card loans securitized and sold, the loans are removed from our balance sheet and the net earnings
on these securitized assets after paying outside investors are reflected as a component of our securitization
income on a GAAP basis. The following table summarizes the results of our Financial Services segment for
fiscal years 2005, 2004 and 2003 on a GAAP basis with interest and fee income, interest expense and provision
for loan losses for the credit card loans receivable we own reported in net interest income. Non-interest income
on a GAAP basis includes servicing income, gains on sales of loans and income recognized on our retained
interests for the entire securitized portfolio, as well as, interchange income on the entire managed portfolio.
Financial Services Revenue as reported in the Financial Statements:
Fiscal Years
2005 2004 2003
(Dollars in thousands)
Interest and fee income ............................................ $ 17,196 $ 12,735 $ 7,858
Interest expense .................................................. (3,241) (3,063) (3,226)
Net interest income ............................................... 13,955 9,672 4,632
Non-interest income:
Securitization income (1) ...................................... 133,032 96,466 74,472
Other non-interest income ..................................... 31,836 24,905 19,050
Total non-interest income .................................. 164,868 121,371 93,522
Less: Customer rewards costs ....................................... (62,723) (52,939) (39,876)
Financial Services revenue ......................................... $116,100 $ 78,104 $ 58,278
(1) For the fiscal years ended 2005, 2004 and 2003, we recognized gains on sale of credit card loans of $17.0
million, $8.9 million and $5.9 million, respectively, which are reflected as a component of securitization
income.
Our “managed” credit card loans represent credit card loans receivable we own plus securitized credit card
loans. Since the financial performance of the managed portfolio has a significant impact on the earnings we will
receive from servicing the portfolio, we believe the following table on a “managed” basis is important
information to analyze our revenue in the Financial Services segment. This non-GAAP presentation reflects the
financial performance of the credit card loans receivable we own plus those that have been sold for the fiscal
years ended 2005, 2004 and 2003 and includes the effect of recording the retained interest at fair value. Interest
income, interchange income (net of customer rewards) and fee income on both the owned and securitized
portfolio are recorded in their respective line items. Interest paid to outside investors on the securitized credit
card loans is included with other interest costs and included in interest expense. Credit losses on the entire
managed portfolio are included in provision for loan losses. Although our financial statements are not presented
in this manner, management reviews the performance of its managed portfolio in order to evaluate the
effectiveness of its origination and collection activities, which ultimately affects the income we will receive for
servicing the portfolio. The securitization of credit card loans primarily converts interest income, interchange
income, credit card fees, credit losses and other income and expense related to the securitized loans into
securitization income.
37