Cabela's 2005 Annual Report Download - page 90
Download and view the complete annual report
Please find page 90 of the 2005 Cabela's annual report below. You can navigate through the pages in the report by either clicking on the pages listed below, or by using the keyword search tool below to find specific information within the annual report.-
 1
1 -
2
-
3
-
4
-
5
-
6
-
7
-
8
-
9
-
10
-
11
-
12
-
13
-
14
-
15
-
16
-
17
-
18
-
19
-
20
-
21
-
22
-
23
-
24
-
25
-
26
-
27
-
28
-
29
-
30
-
31
-
32
-
33
-
34
-
35
-
36
-
37
-
38
-
39
-
40
-
41
-
42
-
43
-
44
-
45
-
46
-
47
-
48
-
49
-
50
-
51
-
52
-
53
-
54
-
55
-
56
-
57
-
58
-
59
-
60
-
61
-
62
-
63
-
64
-
65
-
66
-
67
-
68
-
69
-
70
-
71
-
72
-
73
-
74
-
75
-
76
-
77
-
78
-
79
-
 80
80 -
 81
81 -
 82
82 -
 83
83 -
 84
84 -
 85
85 -
 86
86 -
 87
87 -
 88
88 -
 89
89 -
 90
90 -
 91
91 -
 92
92 -
 93
93 -
 94
94 -
 95
95 -
 96
96 -
 97
97 -
 98
98 -
 99
99 -
 100
100 -
101
-
102
-
103
-
104
-
105
-
106
-
107
-
108
-
109
-
110
-
111
-
112
-
113
-
114
-
115
-
116
-
117
-
118
-
119
-
120
-
121
-
122
-
123
-
124
-
125
-
126
 |
 |

CABELA’S INCORPORATED AND SUBSIDIARIES
NOTES TO CONSOLIDATED FINANCIAL STATEMENTS—(Continued)
(Dollar Amounts in Thousands Except Share and Per Share Amounts)
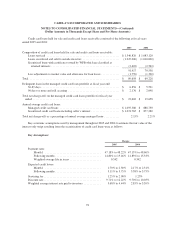
Credit card loans held for sale and credit card loans receivable consisted of the following at fiscal years
ended 2005 and 2004:
2005 2004
Composition of credit card loans held for sale and credit card loans receivable:
Loans serviced ................................................... $1,340,820 $ 1,083,120
Loans securitized and sold to outside investors .......................... (1,247,000) (1,010,000)
Securitized loans with certificates owned by WFB which are classified as
retained interests ................................................ (2,403) (2,562)
91,417 70,558
Less adjustments to market value and allowance for loan losses ............. (1,759) (1,330)
Total ............................................................... $ 89,658 $ 69,228
Delinquent loans in the managed credit card loan portfolio at fiscal year end:
30-89 days ....................................................... $ 6,856 $ 5,591
90 days or more and still accruing .................................... $ 2,176 $ 2,098
Total net charge-offs on the managed credit card loans portfolio for fiscal year
ended ............................................................. $ 23,602 $ 19,658
Annual average credit card loans:
Managed credit card loans .......................................... $1,095,580 $ 888,730
Securitized credit card loans including seller’s interest .................... $1,074,765 $ 877,280
Total net charge-offs as a percentage of annual average managed loans ........... 2.15% 2.21%
Key economic assumptions used by management throughout 2005 and 2004 to estimate the fair value of the
interest only strips resulting from the securitization of credit card loans were as follows:
Key Assumptions:
Ranges
2005 2004
Payment rates:
Month 1 ....................................... 47.18% to 48.22% 47.15% to 48.60%
Following months ................................ 14.80% to 15.46% 14.83% to 15.33%
Weighted average life in years ...................... 0.542 0.542
Expected credit losses:
Month 1 ....................................... 1.70% to 2.30% 2.17% to 2.31%
Following months ................................ 3.11% to 3.75% 3.58% to 3.75%
Servicing fee ........................................ 1.25% to 2.00% 1.25%
Discount rate ........................................ 9.71% to 12.22% 9.70% to 10.03%
Weighted average interest rate paid to investors ............ 3.68% to 4.44% 2.83% to 3.39%
78