Cabela's 2005 Annual Report Download - page 91
Download and view the complete annual report
Please find page 91 of the 2005 Cabela's annual report below. You can navigate through the pages in the report by either clicking on the pages listed below, or by using the keyword search tool below to find specific information within the annual report.-
 1
1 -
2
-
3
-
4
-
5
-
6
-
7
-
8
-
9
-
10
-
11
-
12
-
13
-
14
-
15
-
16
-
17
-
18
-
19
-
20
-
21
-
22
-
23
-
24
-
25
-
26
-
27
-
28
-
29
-
30
-
31
-
32
-
33
-
34
-
35
-
36
-
37
-
38
-
39
-
40
-
41
-
42
-
43
-
44
-
45
-
46
-
47
-
48
-
49
-
50
-
51
-
52
-
53
-
54
-
55
-
56
-
57
-
58
-
59
-
60
-
61
-
62
-
63
-
64
-
65
-
66
-
67
-
68
-
69
-
70
-
71
-
72
-
73
-
74
-
75
-
76
-
77
-
78
-
79
-
80
-
 81
81 -
 82
82 -
 83
83 -
 84
84 -
 85
85 -
 86
86 -
 87
87 -
 88
88 -
 89
89 -
 90
90 -
 91
91 -
 92
92 -
 93
93 -
 94
94 -
 95
95 -
 96
96 -
 97
97 -
 98
98 -
 99
99 -
 100
100 -
 101
101 -
102
-
103
-
104
-
105
-
106
-
107
-
108
-
109
-
110
-
111
-
112
-
113
-
114
-
115
-
116
-
117
-
118
-
119
-
120
-
121
-
122
-
123
-
124
-
125
-
126
 |
 |

CABELA’S INCORPORATED AND SUBSIDIARIES
NOTES TO CONSOLIDATED FINANCIAL STATEMENTS—(Continued)
(Dollar Amounts in Thousands Except Share and Per Share Amounts)
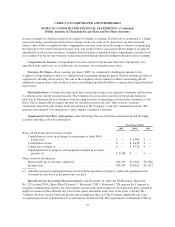
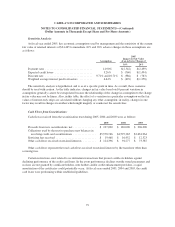
Sensitivity Analysis:
At fiscal year ended 2005, key economic assumptions used by management and the sensitivity of the current
fair value of retained interests of $34,465 to immediate 10% and 20% adverse changes in those assumptions are
as follows:
Assumption
2005
Impact on Fair Value
of an Adverse Change of
10% 20%
Payment rates ................................. 14.90% $(2,542) $(2,439)
Expected credit losses .......................... 3.26% $ (760) $(1,494)
Discount rate ................................. 9.71% and 10.71% $ (386) $ (763)
Weighted average interest paid to investors ......... 4.44% $ (629) $(1,258)
The sensitivity analysis is hypothetical and is as of a specific point in time. As a result, these scenarios
should be used with caution. As the table indicates, changes in fair value based on 10 percent variation in
assumptions generally cannot be extrapolated because the relationship of the change in assumption to the change
in fair value may not be linear. Also, in this table, the effect of a variation in a particular assumption on the fair
values of interest-only strips are calculated without changing any other assumption; in reality, changes in one
factor may result in changes in another which might magnify or counteract the sensitivities.
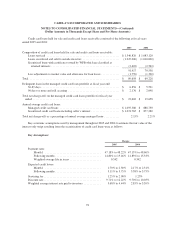
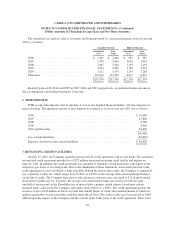
Cash Flows from Securitizations:
Cash flows received from the securitization trust during 2005, 2004 and 2003 were as follows:
2005 2004 2003
Proceeds from new securitizations, net ................ $ 237,000 $ 169,000 $ 206,000
Collections used by the trust to purchase new balances in
revolving credit card securitizations ................ $5,578,746 $4,597,365 $3,634,964
Servicing fees received ............................ $ 19,468 $ 16,452 $ 12,523
Other cash flows received on retained interests ......... $ 124,396 $ 94,277 $ 73,587
Other cash flows represent the total cash flows received on retained interest by the transferor other than
servicing fees.
Certain restrictions exist related to securitization transactions that protect certificate holders against
declining performance of the credit card loans. In the event performance declines outside stated parameters and
waivers are not granted by certificate holders, note holders and/or credit enhancement providers, a rapid
amortization of the certificates could potentially occur. At fiscal years ended 2005, 2004 and 2003, the credit
card loans were performing within established guidelines.
79