Cabela's 2005 Annual Report Download - page 54
Download and view the complete annual report
Please find page 54 of the 2005 Cabela's annual report below. You can navigate through the pages in the report by either clicking on the pages listed below, or by using the keyword search tool below to find specific information within the annual report.-
 1
1 -
2
-
3
-
4
-
5
-
6
-
7
-
8
-
9
-
10
-
11
-
12
-
13
-
14
-
15
-
16
-
17
-
18
-
19
-
20
-
21
-
22
-
23
-
24
-
25
-
26
-
27
-
28
-
29
-
30
-
31
-
32
-
33
-
34
-
35
-
36
-
37
-
38
-
39
-
40
-
41
-
42
-
43
-
 44
44 -
 45
45 -
 46
46 -
 47
47 -
 48
48 -
 49
49 -
 50
50 -
 51
51 -
 52
52 -
 53
53 -
 54
54 -
 55
55 -
 56
56 -
 57
57 -
 58
58 -
 59
59 -
 60
60 -
 61
61 -
 62
62 -
 63
63 -
 64
64 -
65
-
66
-
67
-
68
-
69
-
70
-
71
-
72
-
73
-
74
-
75
-
76
-
77
-
78
-
79
-
80
-
81
-
82
-
83
-
84
-
85
-
86
-
87
-
88
-
89
-
90
-
91
-
92
-
93
-
94
-
95
-
96
-
97
-
98
-
99
-
100
-
101
-
102
-
103
-
104
-
105
-
106
-
107
-
108
-
109
-
110
-
111
-
112
-
113
-
114
-
115
-
116
-
117
-
118
-
119
-
120
-
121
-
122
-
123
-
124
-
125
-
126
 |
 |
income was partially offset by an increase in customer reward costs of $13.1 million, or 32.8%. These costs
generally increase proportionately with the amount of customer VISA purchases. We had various promotions in
the fourth fiscal quarter where customers earned additional rewards, which caused reward points expense to
increase at a higher rate than VISA purchases. Compared to fiscal 2003, the number of average active accounts
grew by 18.5% to 618,951 and the average balance per active account grew by 6.3% to approximately $1,436.
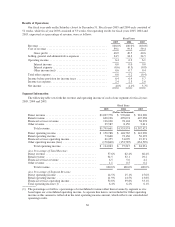
Gross Profit
Gross profit increased by $65.4 million, or 11.6%, to $630.3 million in fiscal 2004 from $564.9 million in
fiscal 2003. As a percentage of revenue, gross profit declined slightly to 40.5% for fiscal 2004, compared to
40.6% in fiscal 2003. Our Financial Services revenue growth of $19.8 million, which does not have any
corresponding increase in cost of revenue, provided for an increase of 0.5% to gross profit as a percent of
revenue. However, this was offset by a decline in merchandising gross profit of 0.4% of merchandise revenue, as
discussed below, and a decline of 0.2% in gross profit as a percent of revenue on our other revenue due to a sale
of land with no gross profit.
Merchandising Business. The gross profit of our merchandising business increased by $46.8 million, or
9.3%, to $551.5 million in fiscal 2004 from $504.7 million in fiscal 2003. As a percentage of merchandise
revenue, gross profit declined by 0.4% to 37.5% in fiscal 2004, from 37.9% in fiscal 2003. The decline was
attributable to increased promotional activities, increased freight costs and a decrease in our net shipping margin.
Promotional activity recorded in net revenue had a negative impact on gross merchandising margin of 0.8% of
merchandise revenue. Increased freight costs of $5.5 million contributed to 0.3% of the decrease in our gross
profit as a percent of merchandise revenue. And finally, a decrease in net shipping margin (shipping income less
shipping expense) decreased our merchandising gross profit by 0.1% of merchandise revenue. These decreases
were partially offset by improved merchandising practices.
Selling, General and Administrative Expenses
Selling, general and administrative expenses increased by $53.1 million, or 11.1%,to $533.1 million in
fiscal 2004 from $480.0 million in fiscal 2003. Selling, general and administrative expenses were 34.3% of
revenue in fiscal 2004, compared to 34.5% in fiscal 2003. The most significant factors contributing to the
increase in selling, general and administrative expenses included:
• Selling, general and administrative expenses attributed to shared services comprised $17.0 million of the
total increase in selling, general and administrative expense and increased primarily as a result of the
addition of new employees, which increased salary and wages, related taxes, insurance and benefits, and
401(k) matching expense by $14.7 million. The additional new employees were hired primarily in the
distribution department, relating to the new distribution center in Wheeling, West Virginia. In addition
to new employees, there was a $1.7 million compensation charge related to stock options granted at less
than fair market value under our 2004 stock plan, which was included in the increase in salary and
wages. Professional fees increased over the prior year by $1.9 million. $0.6 million is attributable to
costs of the secondary offering that were expensed in the fourth fiscal quarter. We also incurred
increases in various selling, general and administrative expense line items, which in total were $0.8
million, and were related to moving an operation to a new location.
•Direct selling, general and administrative expenses comprised $12.9 million of the total increase in
selling, general and administrative expense and increased primarily as a result of an increase in catalog
production costs of $12.4 million, or 9.2%. Catalog costs increased to $146.4 million, or 15.1% of
Direct revenue in fiscal 2004, from $134.0 million, or 14.5% of Direct revenue in fiscal 2003. This
increase in catalog costs as a percent of our Direct revenue was primarily due to the following factors:
sales in the first half of the year that were below our expectations and our continued use of our catalog
as a marketing tool to increase brand awareness and to encourage customers to visit our destination
retail stores. Our credit card discount fees increased by $1.1 million but were still in line with the
increase as a percentage of revenue. All other costs remained flat as a percentage of revenue.
42